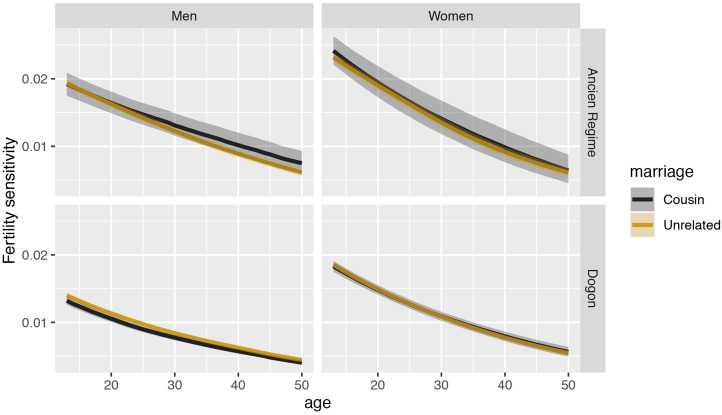
Figure 4.
Sensitivity of the projected lineage growth rate to changes in fertility (on the y-axis) for each reproductive age (on the x-axis) for both Dogon (bottom row) and Ancien Régime (upper row) populations. Estimates for men are plotted in the left column and estimates for women are plotted in the right column. Estimates for those practising cousin marriage are plotted in black and estimates for those not practising it are plotted in yellow. The shaded regions represent the 90% compatibility intervals.

