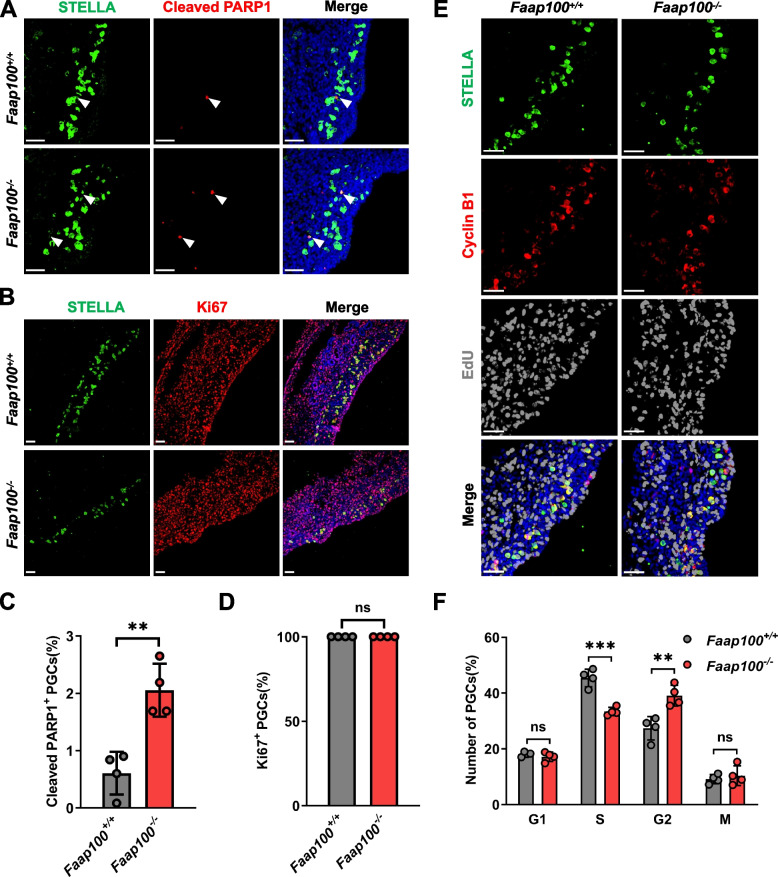
Fig. 3.
Deletion of Faap100 results in proliferation defects of PGCs. A, C, Representative images (A) and quantification (C) of apoptotic PGCs (STELLA+, cleaved PARP1+) in Faap100+/+ and Faap100−/− genital ridges at E11.5. n = 4/4 embryos (1067/1000/1344/1200; 365/296/118/339 PGCs). The arrowheads indicate representative apoptotic PGCs. Scale bars, 50 μm. B, D, Representative images (B) and quantification (D) of PGCs (STELLA+) also positive for Ki67 in Faap100+/+ and Faap100−/− genital ridges at E11.5. n = 4/4 embryos (523/567/636/718; 247/361/249/359 PGCs). Scale bars, 50 μm. E, F, Representative images (E) and quantification (F) of the cell cycle distribution of PGCs (STELLA+), assessed by co-staining for Cyclin B1 and EdU, in Faap100+/+ and Faap100−/− genital ridges at E11.5. n = 4/4 embryos (1306/656/1046/506; 341/128/337/398 PGCs). In this system, Cyclin B1-negative cells are in G1 phase; EdU-positive cells are in S phase; cells expressing Cyclin B1 in the nucleus are in M phase; and the remaining cells expressing Cyclin B1 in the cytoplasm are in G2 phase. Scale bars, 50 μm. Data are shown as the mean ± SD (C, D, F). Unpaired two-tailed Student’s t-test (C, F) and two-tailed Mann–Whitney U-test (D), ns, not significant, **P < 0.01 and ***P < 0.001

