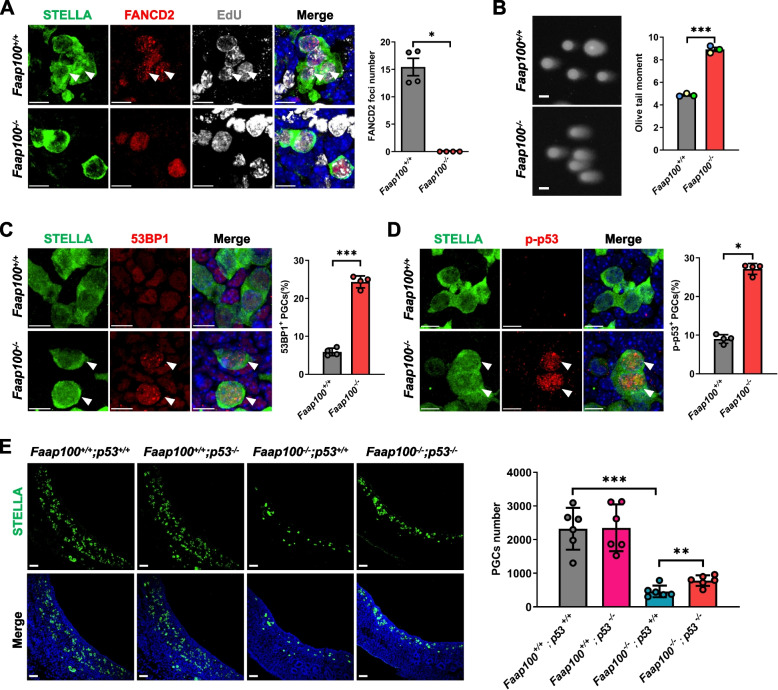
Fig. 4.
FAAP100 deficiency leads to FA pathway inactivation, DNA damage accumulation and p53 signaling activation in PGCs. A Representative images and quantification of FANCD2 foci in PGCs (STELLA+) at E11.5. n = 4/4 embryos (200/136/145/127; 151/118/140/124 PGCs). The arrowheads indicate FANCD2 foci in PGCs. Scale bars, 10 μm. B Representative images and quantification of neutral comet assay tail moment in MACS-sorted PGCs at E11.5. A total of 200 PGCs sorted from 5 embryos of per genotype were scored. Three independent experiments were conducted. Scale bars, 10 μm. C Representative images and percentage of PGCs (STELLA+) stained positively for 53BP1 in E11.5 genital ridges. n = 4/4 embryos (1490/780/786/1340; 362/228/320/299 PGCs). The arrowheads indicate representative 53BP1-positive PGCs. Scale bars, 10 μm. D Representative images and percentage of PGCs (STELLA+) also positive for p-p53 in E11.5 genital ridges. n = 4/4 embryos (522/620/360/352; 311/220/177/226 PGCs). The arrowheads indicate representative p-p53-positive PGCs. Scale bars, 10 μm. E Representative images and quantification of PGCs (STELLA+) in E11.5 genital ridges of the indicated genotypes. n = 6 embryos per genotype. Scale bars, 50 μm. Data are shown as the mean ± SEM (A, B) or mean ± SD (C-E). Two-tailed Mann–Whitney U-test (A, D) and unpaired two-tailed Student’s t-test (B, C, E), *P < 0.05, **P < 0.01 and ***P < 0.001

