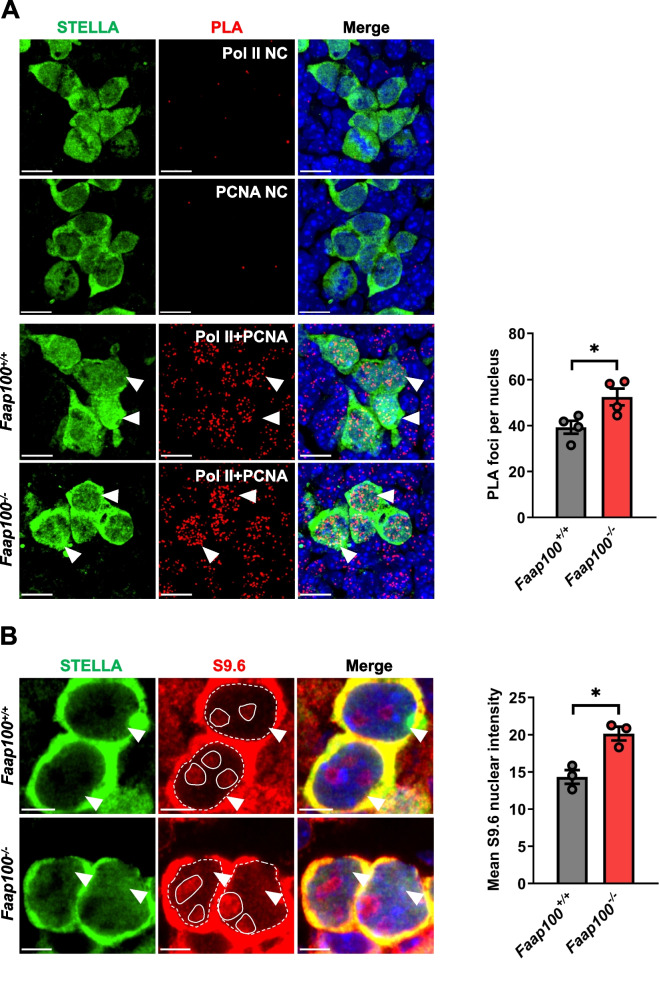
Fig. 5.
TRCs and R-loops accumulate in Faap100−/− PGCs. A Representative images and quantification of Pol II + PCNA PLA foci in E11.5 PGCs (STELLA+). Pol II alone staining and PCNA alone staining were used as single antibody negative control (NC). n = 4/4 embryos (202/150/150/156; 208/150/151/150 PGCs). The arrowheads indicate representative PGCs. Scale bars, 10 μm. B Representative images and quantification of S9.6 nuclear signal intensity after subtracting the nucleolar signal circled with the solid lines in E11.5 PGCs (STELLA+). n = 3/3 embryos (207/205/216; 210/197/201 PGCs). The arrowheads indicate representative PGCs. Scale bars, 5 μm. Data are shown as the mean ± SEM (A, B). Unpaired two-tailed Student’s t-test (A, B), *P < 0.05

