Fig. 6.
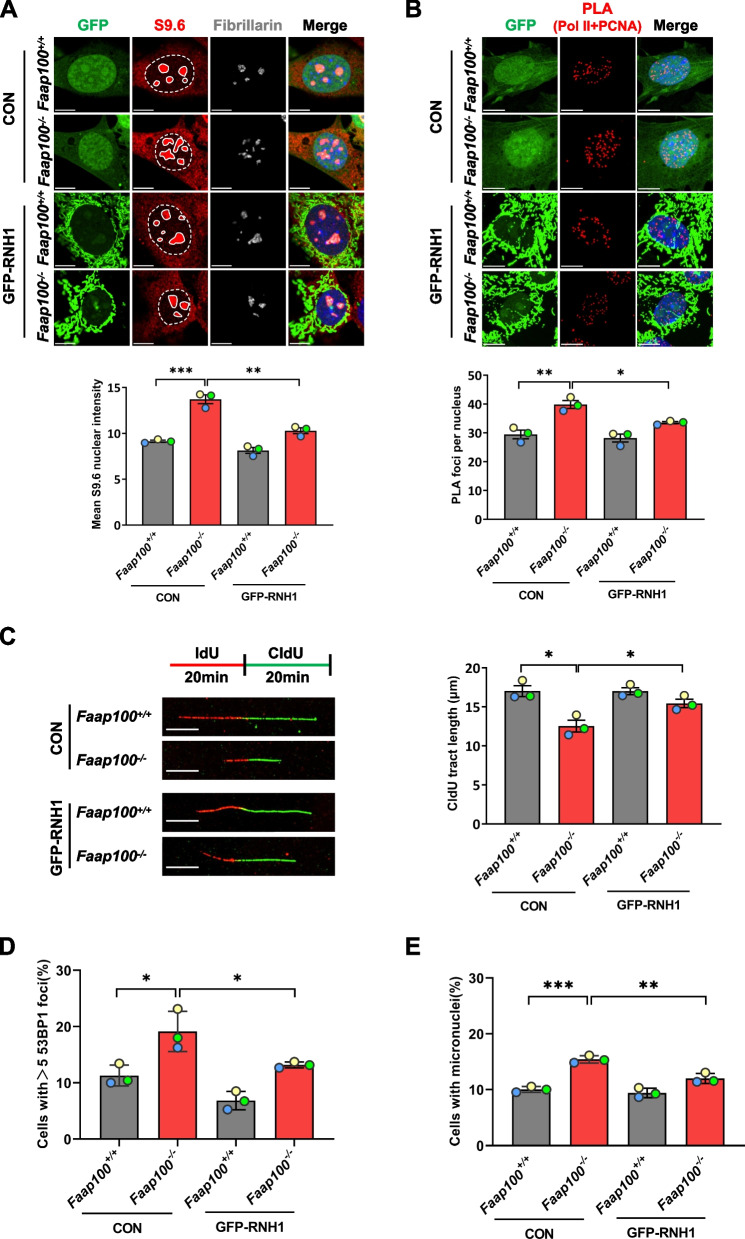
R-loop accumulation aggravates TRCs and impedes fork progression in Faap100−/− MEFs. A Representative images and quantification of S9.6 nuclear signal intensity (exclusive of nucleolar signal that is positive for fibrillarin staining) in MEFs overexpressing control (GFP) or GFP-RNaseH1 (GFP-RNH1) adenovirus. At least 200 cells were scored per group. Three independent experiments were conducted. Scale bars, 10 μm. B Representative images and quantification of Pol II + PCNA PLA foci in MEFs treated as in A. At least 200 cells were scored per group. Three independent experiments were conducted. Scale bars, 10 μm. C Representative images and quantification of CldU tract lengths in MEFs treated as in A. At least 200 DNA fibers were scored per group. Three independent experiments were conducted. Scale bars, 10 μm. D, E, Percentage of MEFs containing > 5 53BP1 foci (D) or micronuclei (E) after treatment as in A. At least 200 cells were scored per group. Three independent experiments were conducted. Data are shown as the mean ± SEM (A-C) or mean ± SD (D, E). Unpaired two-tailed Student’s t-test (A-E), *P < 0.05, **P < 0.01 and ***P < 0.001

