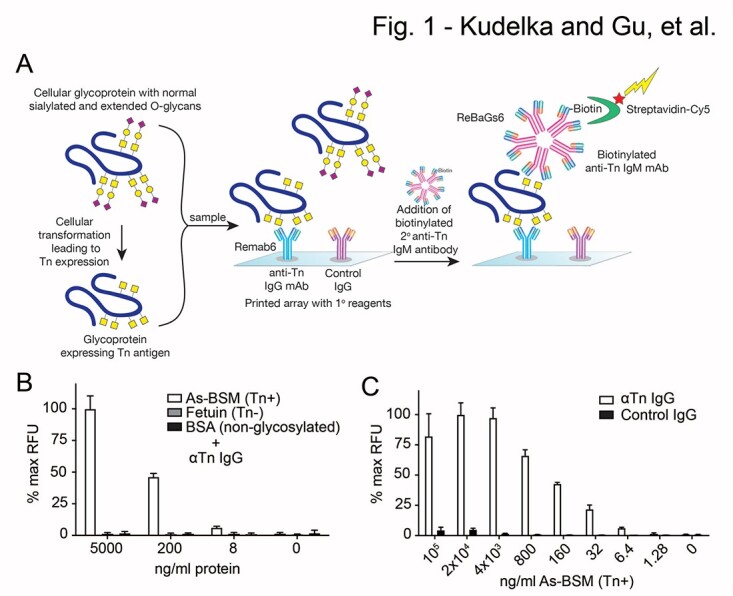
Fig. 1.

ATAM platform and analysis of defined glycoproteins. a) Tn containing glycoproteins are incubated on the antibody microarray with printed Remab6 and isotype control. Tn antigen captured from the samples is probed with biotinylated ReBaGs6 in a sandwich format and detected with fluorescently labeled streptavidin, which is read in a microarray scanner. Yellow square = GalNAc (Tn). b) ATAM analysis of Tn+ AsBSM, Tn(−) fetuin, and non-glycosylated BSA at various concentrations. c) ATAM analysis of Tn+ AsBSM at various dilutions. Data were normalized to 100 μg/ml printed AsBSM for each well and then to max RFU for each panel. Two independent repeats were performed for b) and c), error bars = ±1 SD.
