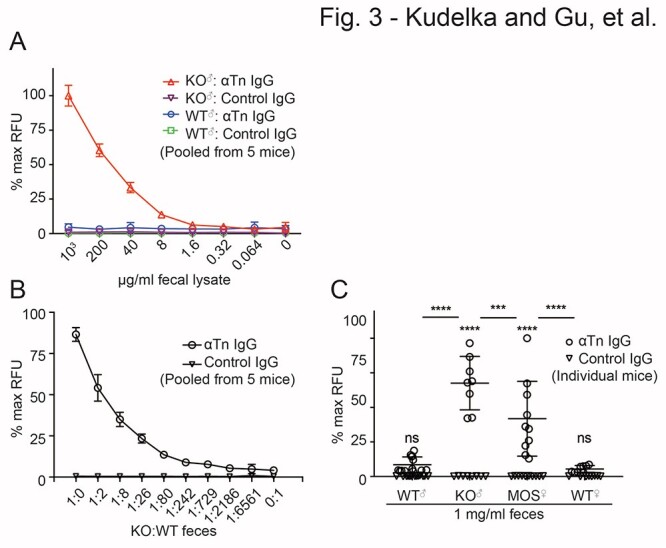
Fig. 3.

ATAM analysis of Tn+ feces. a) Anti-Tn microarray analysis of WT and KO feces at various dilutions (5 mice pooled/group), b) WT and KO feces mixed at different ratios (5 mice pooled/group prior to mixing), and c) WT male (n = 13), KO (n = 8), mosaic (n = 10), and WT female (n = 8) feces at 1 mg/mL (data from 2 independent experiments pooled and shown on graph). Data were normalized to 100 μg/ml printed AsBSM for each well and then to max RFU for each panel. Two independent repeats from separate groups of mice were performed for a–c). Data in c) were pooled from repeats. Error bars = ±1 SD of spot replicates for a) and b), and of individually analyzed mice for c). For c), 2-way ANOVA and post hoc multiple comparisons with SIDAK correction (**** = P < 0.0001, *** = P = 0.0005, alpha = 0.05); P-value over each genotype compares printed anti-Tn IgG versus isotype control within a genotype; P-value between groups compares anti-Tn expression across genotypes.
