Figure 2. .
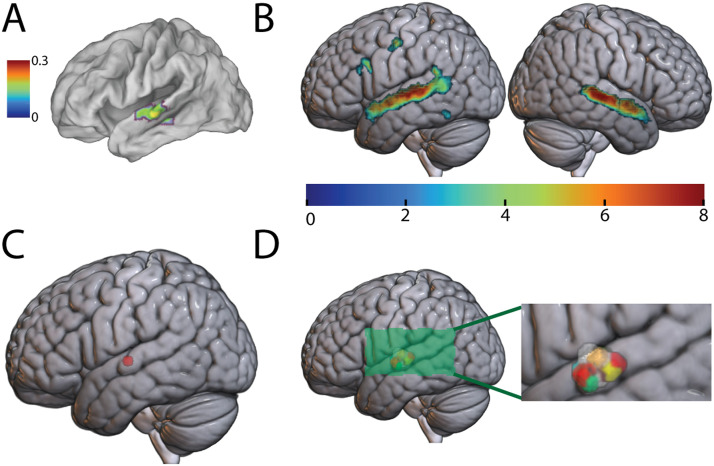
Identifying the auditory word form area (AWFA). (A) Proposed location of the AWFA (MNI: −61, −15, −5). Adapted from DeWitt and Rauschecker (2012). Color bar (arbitrary units) reflects the activation likelihood estimatoin (Laird et al., 2005) statistic. (B) The RW vs. Silence contrast (p < 0.001) masked by the RW vs. Scrambled Real Words contrast (p < 0.05) in the auditory localizer scan. Only clusters significant at the FDR p < 0.05 level are shown. Colors reflect t statistics. (C) The peak in the left STG (MNI: −62, −14, 2). (D) The AWFA defined in individual subjects. The inset zooms in on the perisylvian region to highlight the location of the AWFA.

