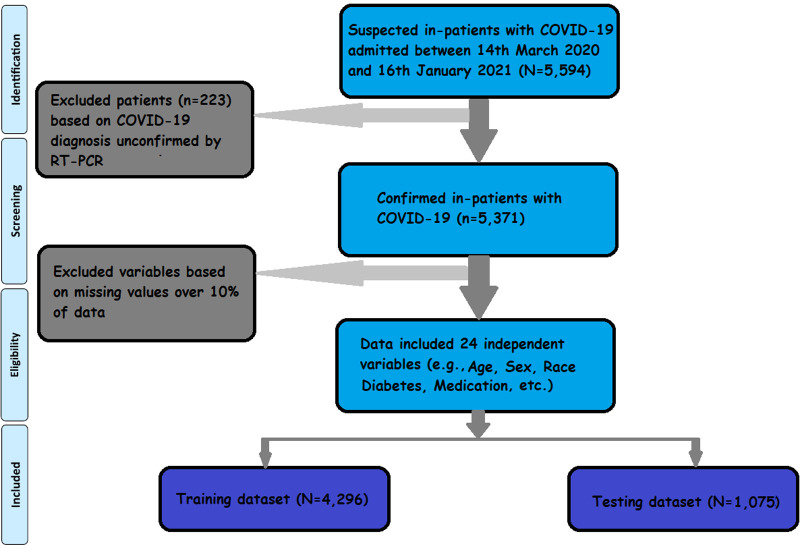
Figure 1.
Work flowchart. Flowchart depicts the data inclusion strategy. Of the “5,594” hospitalized cases, “5,371” are confirmed COVID-19 cases. After excluding variables for missing data, 25 variables (among them, 24 are independent variables, and “mortality” is a dependent variable) meet the inclusion criteria.

