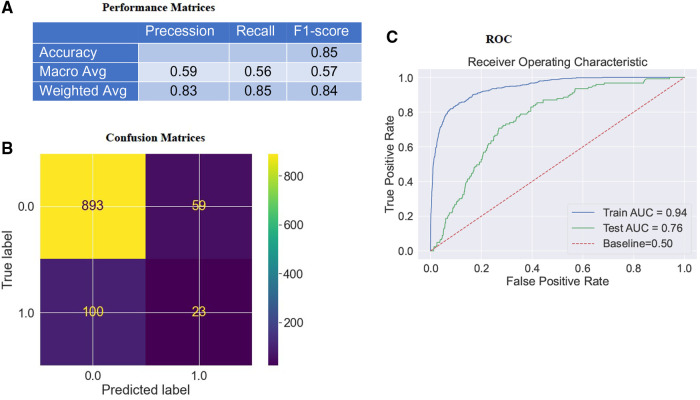
Figure 2.
Confusion matrices & AUC curve of the model. (A) depicts the model's F1-score (weighted) as 84%. (B) depicts that the model accurately classifies “916” instances and misclassifies “159” instances of test data. “Survival” and “mortality”, classifies respectively as “0” or “1”. (C) indicates an ROC curve created by comparing TPR and FPR. The Area Under the Receiver Operating System (ROC) Curve (AUC) for the RF classifier on the testing dataset is about 0.76, which is better than a no-skill classifier with a score of 0.50.

