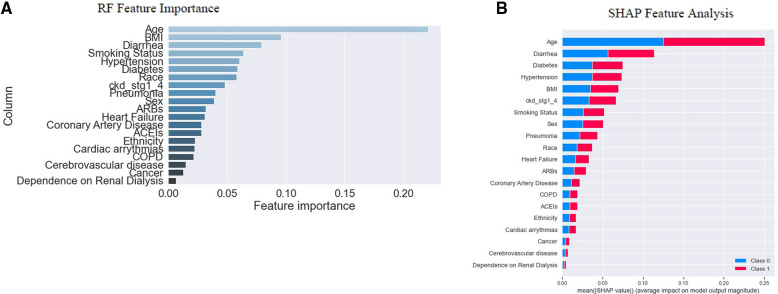
Figure 3.
Feature importance. In (A), RF's “built-in” method allows us to look at feature importance, corresponding to the decrease in the Gini index of a feature at each split. Notably, the Gini coefficient is used to evaluate the degree of inequality within these features. As the Gini index decreases for a feature, it becomes more important (41, 45). (B) indicates the SHAP global feature importance. The important features are in the sequence where the color difference shows the binary classes; 0 (“blue”) indicates “survival”, and “1” (“red”) indicates “mortality”. From the diagrams above, we note that the actual importance of each feature given by the two methods is similar but not identical.

