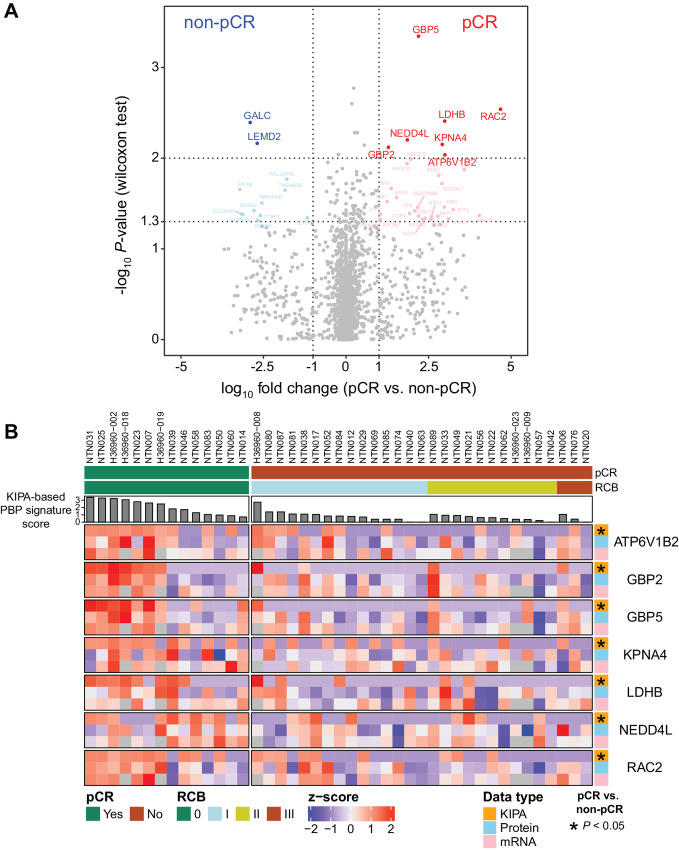
FIGURE 2.
Differential protein analysis between pCR and non-pCR samples. A, Volcano plot shows results from differential analysis between pCR and non-pCR samples with the KIPA. X-axis is the log10 fold change between median value of pCR and non-pCR samples for each protein. Y-axis is the −log10P-value from Wilcoxon rank-sum tests comparing protein levels in pCR samples to non-pCR samples. Red and blue points indicate the most significant (P < 0.01) proteins, and pink and light blue points indicate significant (0.01 < P < 0.05) proteins. B, Heat map shows the levels of seven PBP signature genes across 43 samples, arranged by RCB class (0, I, II, II) and the KIPA-based PBP signature score. The levels of seven genes were assessed at the level of KIPA (orange), protein (light blue), and mRNA (pink), and normalized across all samples by z-score. P values were determined by Wilcoxon rank-sum tests comparing gene levels for pCR samples to non-pCR samples. PBP signature, purine-binding protein signature.

