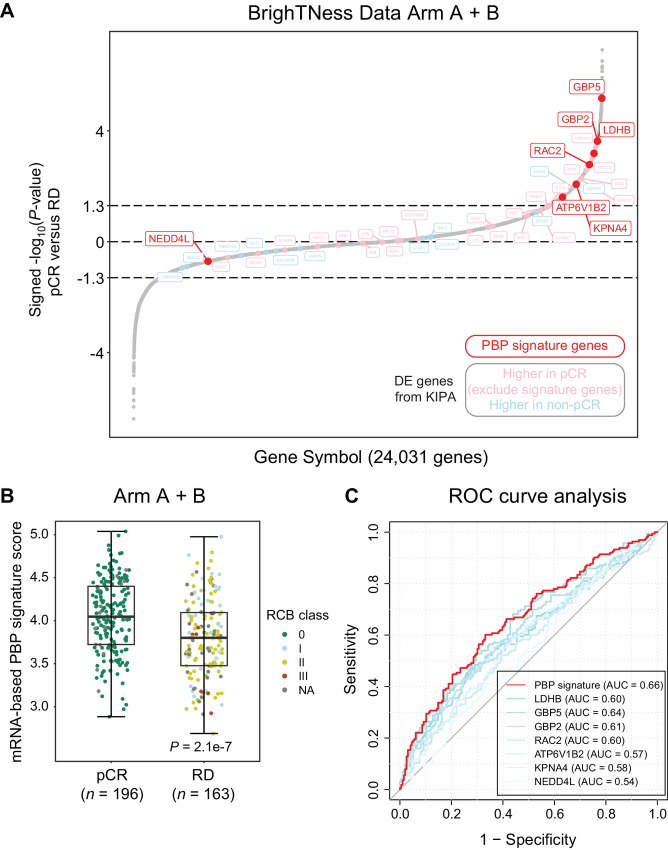
FIGURE 4.
Validation of candidates identified from the KIPA analysis in the BrighTNess dataset. A, The differential proteins from the KIPA analysis were examined in the BrighTNess dataset (Arm A + B) where patients with TNBC were treated with carboplatin and paclitaxel with or without veliparib. The 24,031 genes were ranked on the basis of signed −log10 of P values from Wilcoxon rank-sum tests comparing mRNA levels for pCR samples with RD samples. Positive values indicate higher expression in pCR samples, and negative values indicate higher expression in RD samples. The PBP signature genes were indicated as red dots, and other differential proteins from the KIPA analysis were indicated as either pink (higher in pCR samples) or light blue (higher in non-pCR samples) dots. B, The levels of mRNA-based PBP signature in pCR and RD samples. Boxplots show interquartile range (IQR) with median marked in center. Whiskers indicate 1.5x IQR. P value was determined by Wilcoxon rank-sum test between pCR and RD samples. C, ROC curve analysis to test the validity of mRNA-based PBP signature score and mRNA levels of individual signature genes in discriminating pCR and RD samples. ROC, receiver operating characteristic; AUC, area under the ROC curve.

