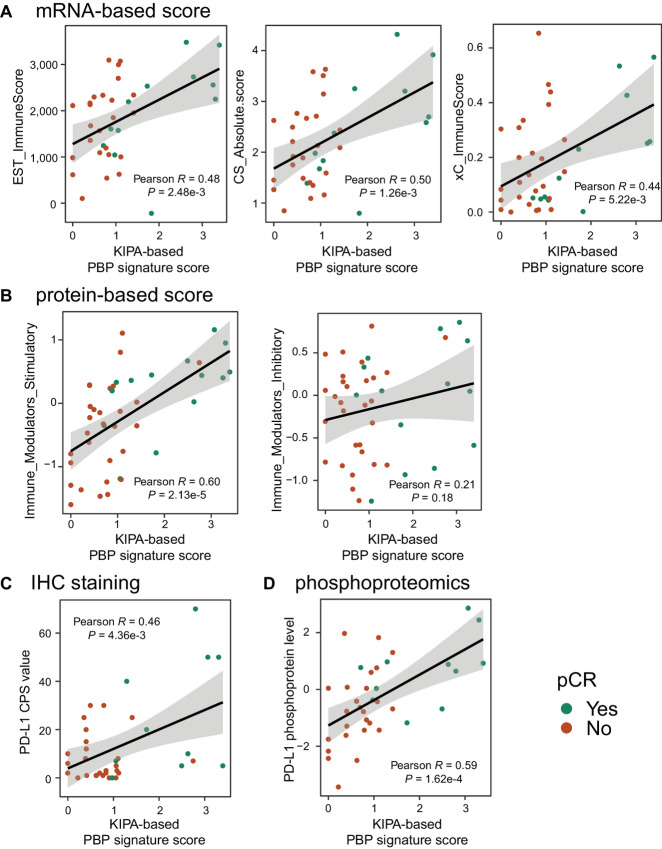
FIGURE 6.
The relationship between the KIPA-based PBP signature score, immune scores, and immune checkpoint levels. A, Scatter plot shows the correlation between the KIPA-based PBP signature score and mRNA-based immune scores (from ESTIMATE, Cibersort, and xCell). EST: ESTIMATE, CS: Cibersort, xC: xCell. B, Scatter plot shows the correlation between the KIPA-based PBP signature score and protein-based immune modulator stimulatory or inhibitory scores. C, Scatter plot shows the correlation between the KIPA-based PBP signature score and PD-L1 CPSs from IHC staining. D, Scatter plot shows the correlation between the KIPA-based PBP signature score and PD-L1 phosphoprotein levels.

