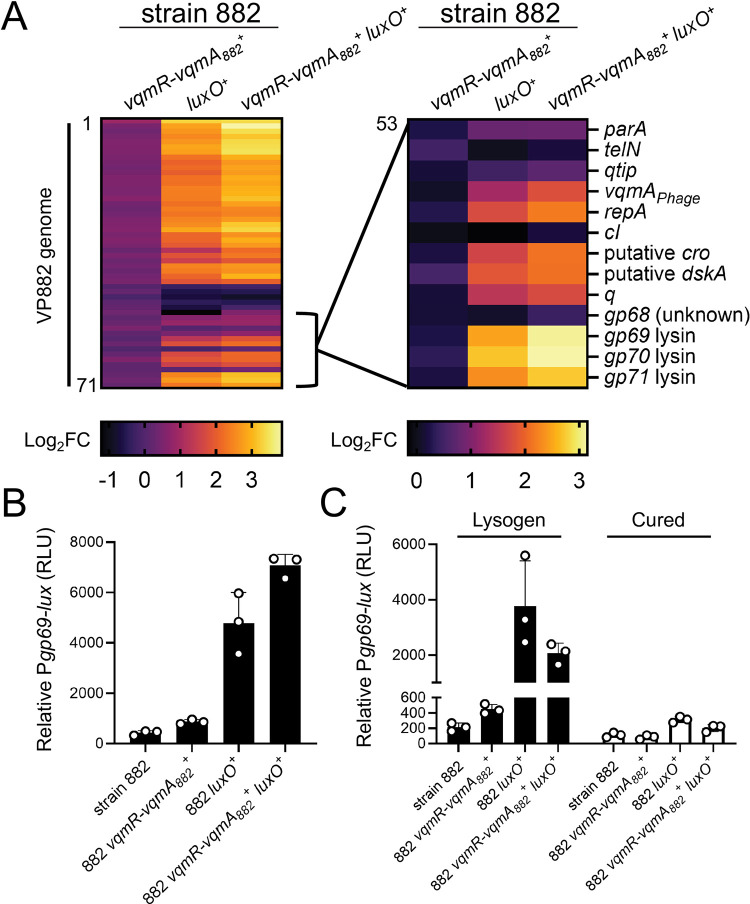
Fig 4. Restoration of host QS function activates phage VP882 gene expression.
(A) Left: heatmap showing log2 fold changes (FC) of all quantified genes in phage VP882 (gp1-71) in the indicated 882 strains. Data are normalized to the parent 882 strain. Numerical values for heatmaps are available in S1 Table. Increasing brightness represents increasing gene expression. Right: as in the left panel, heatmap showing log2 fold changes of the indicated phage VP882 genes (gp53-71). (B) Relative Pgp69-lux output in the indicated 882 strains. (C) Relative Pgp69-lux output in the indicated 882 strains carrying either phage VP882 (lysogen; black bars) or lacking phage VP882 (cured; white bars). Data are represented as means with n = 3 biological replicates (A), and as means ± std with n = 3 biological replicates (B, C). RLU as in Fig 2B (B, C).

