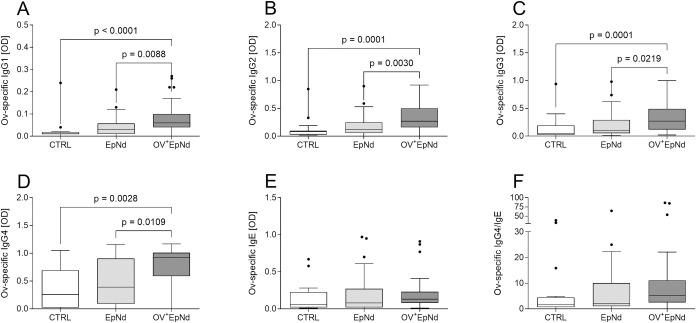
Fig 4. Increased antigen-specific IgGs in OV+EpNd patients.
Levels of (A) O. volvulus-specific IgG1, (B) IgG2, (C) IgG3, (D) IgG4, (E) IgE and (F) the ratio of IgG4/IgE from plasma samples (CTRL, n = 16, EpNd, n = 32, OV+EpNd, n = 51) were determined using ELISA. Graphs depict box whiskers with median, interquartile ranges and outliers. Statistical significances between the indicated groups were obtained with Kruskal-Wallis followed by a Dunn’s multiple comparison test.

