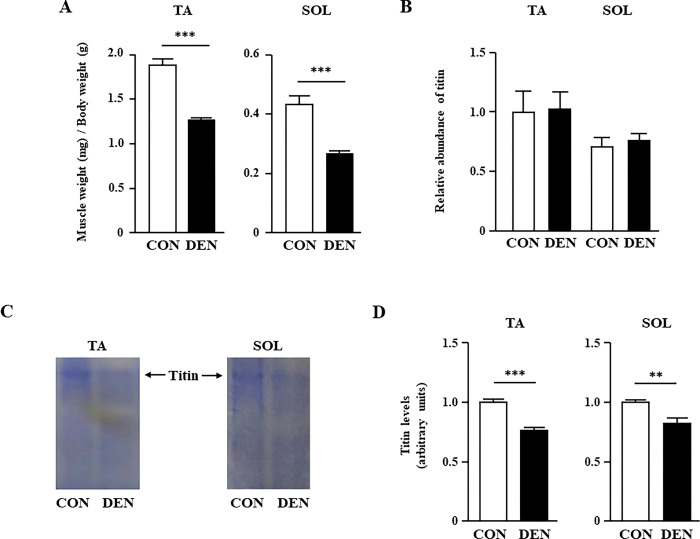
Fig 1. The effects of muscle atrophy induced by denervation on muscle weight and titin expression levels.
(A) The weight in the TA and SOL muscles of the CON and DEN groups on post-operative day 10. (B) Quantification of real-time PCR products for titin expression in the TA and SOL muscles of the CON and DEN groups on post-operative day 10. (C) Typical SDS-PAGE image showing titin level in the TA and SOL muscles of the CON and DEN groups. (D) Quantification of titin in the TA and SOL muscles of the CON and DEN groups on post-operative day 10. Data are presented as the means ± standard error of the mean (SEM). **p < 0.01 and ***p < 0.001 by an unpaired t-test.

