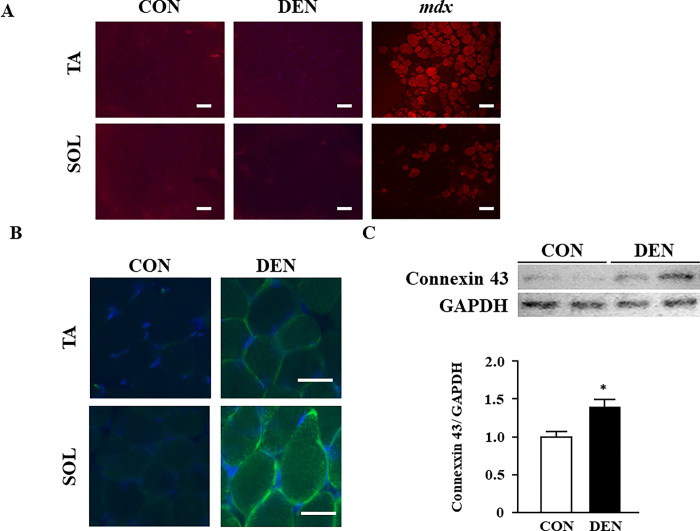
Fig 4. The effects of muscle atrophy induced by denervation on the stabilization of muscle membrane and expression levels of connexin 43.
(A) Evans blue staining in the TA and SOL muscles of the CON and DEN groups on post-operative day 6. The TA muscle of mdx mice is shown as a positive control. Scale bar: 100 μm. (B) Immunohistochemical staining of connexin 43 in the TA and SOL muscles. Scale bar: 50 μm. (C) Western blot of connexin 43 in the TA muscle. The bar graph shows relative connexin levels compared to those of GAPDH. Data are presented as means ± standard error of the mean (SEM). n = 6/group. *p < 0.05 by an unpaired t-test.

