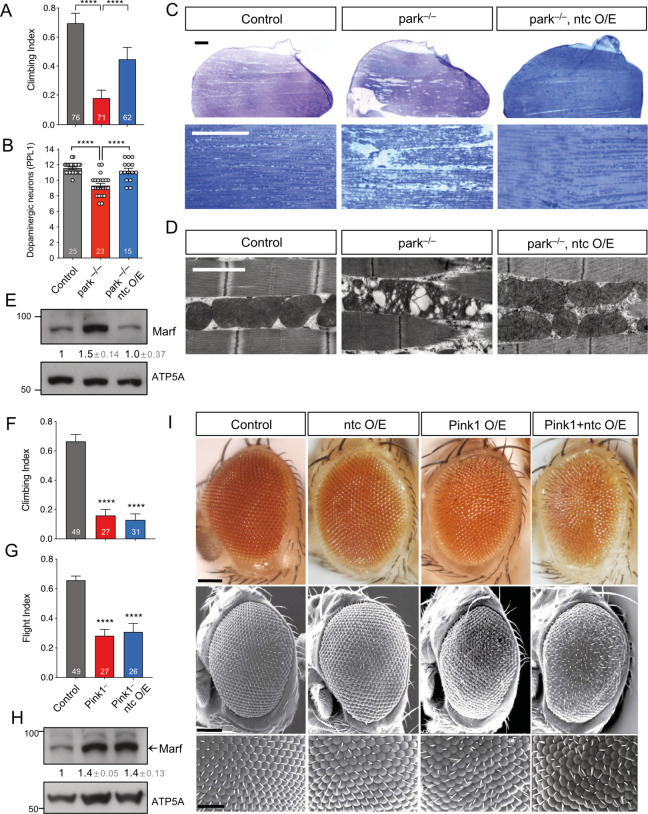
Fig 1. ntc overexpression is able to rescue parkin but not Pink1 mutants.
(A) Climbing ability of 2-day-old control and parkin mutants alone or with transgenic expression of ntc with the ubiquitous driver da-GAL4. Chart show mean ± 95% CI and n values. Kruskal–Wallis nonparametric test with Dunn’s post hoc test correction for multiple comparisons; **** P < 0.0001. (B) Quantification of dopaminergic neurons (PPL1 cluster) in 30-day-old control and parkin mutants alone or with transgenic expression of ntc with the ubiquitous driver da-GAL4. Data represented as mean ± SEM; n shown in chart. One-way ANOVA with Bonferroni post hoc test correction; **** P < 0.0001. (C) Toluidine blue staining and (D) TEM analysis of thoraces from 2-day-old control and parkin mutant alone or with transgenic expression of ntc with the ubiquitous driver da-GAL4. Scale bars; top = 200 μm, middle = 10 μm, bottom = 2 μm. (E) Immunoblot analysis from whole fly lysates of Marf steady-state levels from 2-day-old control and parkin mutants alone or with transgenic expression of ntc with the ubiquitous driver da-GAL4. Numbers below blots indicated the mean ± SD of Marf levels normalised to ATP5A loading control across 3 replicate experiments. (F) Climbing and (G) flight ability of 2-day-old control and Pink1 mutants alone or with transgenic expression of ntc with the ubiquitous driver da-GAL4. Chart show mean ± 95% CI; n shown in chart. Kruskal–Wallis nonparametric test with Dunn’s post hoc test correction for multiple comparisons; **** P < 0.0001. (H) Immunoblot analysis from whole fly lysates of Marf steady-state levels from 2-day-old control and Pink1 mutants alone or with transgenic expression of ntc with the ubiquitous driver da-GAL4. Numbers below blots indicated the mean ± SD of Marf levels normalised to ATP5A loading control across 3 replicate experiments. (I) Analysis of the compound eye by (top panels) light microscopy or (middle and bottom panels) SEM of 2-day-old control, overexpression of ntc, Pink1 or both combine using the GMR-GAL4 driver. Scale bars; top and middle = 100 μm, bottom = 50 μm. Full details of numerical data and analyses underlying the quantitative data can be found in S1 Data. SEM, scanning electron microscopy; TEM, transmission electron microscopy.

