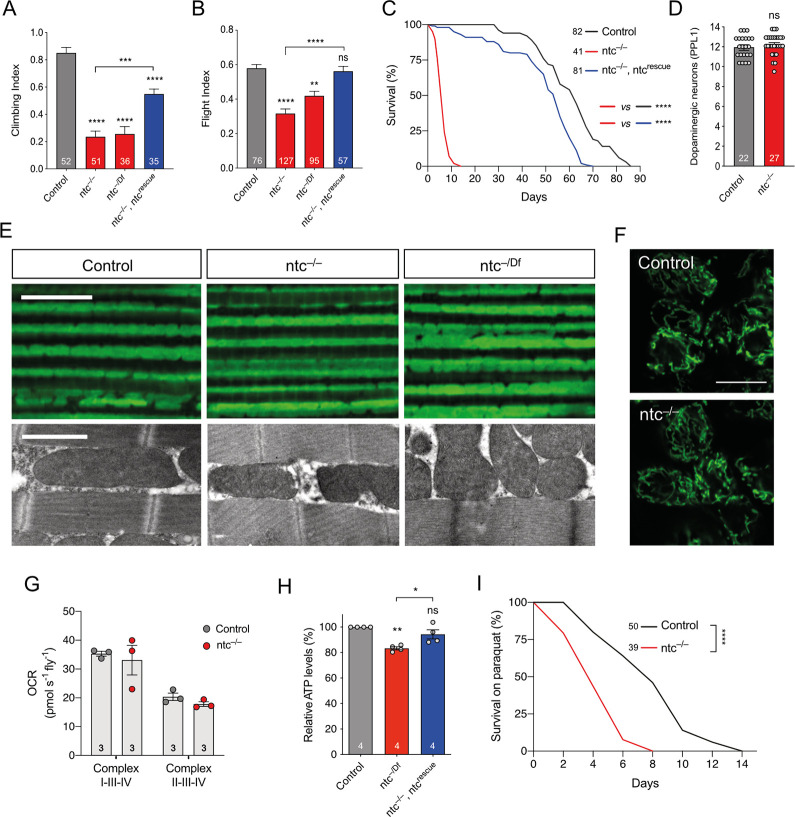
Fig 2. Loss of ntc has motor and lifespan deficits, no gross effect on mitochondria but increased sensitivity to oxidative stress.
Analysis of (A) climbing and (B) flight abilities of 2-day-old control and ntc mutants alone or with transgenic expression of ntc with the ubiquitous driver da-GAL4. Chart show mean ± 95% CI and n values. Kruskal–Wallis nonparametric test with Dunn’s post hoc test correction for multiple comparisons; ** P < 0.01, *** P < 0.001, **** P < 0.0001. (C) Lifespan assay of control and ntc mutants alone or with transgenic expression of ntc with the ubiquitous driver da-GAL4; n shown in chart. Log rank (Mantel–Cox) test; **** P < 0.0001. (D) Quantification of dopaminergic neurons (PPL1 cluster) in 10-day-old control and ntc mutants alone. Data represented as mean ± SEM; n shown in chart. One-way ANOVA with Bonferroni post hoc test correction. (E) (Top panel) Immunohistochemistry with anti-ATP5A staining and (bottom panel) TEM of 2-day-old adult thoraces from control and ntc mutants. Scale bars; top = 10 μm, bottom = 2 μm. (F) Mitochondrial morphology in motoneurons from the ventral nerve cord of third instar larvae in control and ntc mutants, overexpressing mito-GFP with the pan-neuronal driver nSyb-GAL4. Scale bars = 10 μm. (G) Oxygen consumption rate from complex I and complex II of 2-day-old control and ntc mutants. Data represented as mean ± SEM; n shown in chart. One-way ANOVA with Bonferroni post hoc test correction. (H) ATP levels of 2-day-old control and ntc mutants alone or with transgenic expression of ntc with the ubiquitous driver da-GAL4. Data represented as mean ± SEM; n shown in chart. One-way ANOVA with Bonferroni post hoc test correction; * P < 0.05, ** P < 0.01. (I) Lifespan assay of control and ntc mutants treated with 10 μm paraquat; n shown in chart. Log rank (Mantel–Cox) test; **** P < 0.0001. Full details of numerical data and analyses underlying the quantitative data can be found in S1 Data. TEM, transmission electron microscopy.

