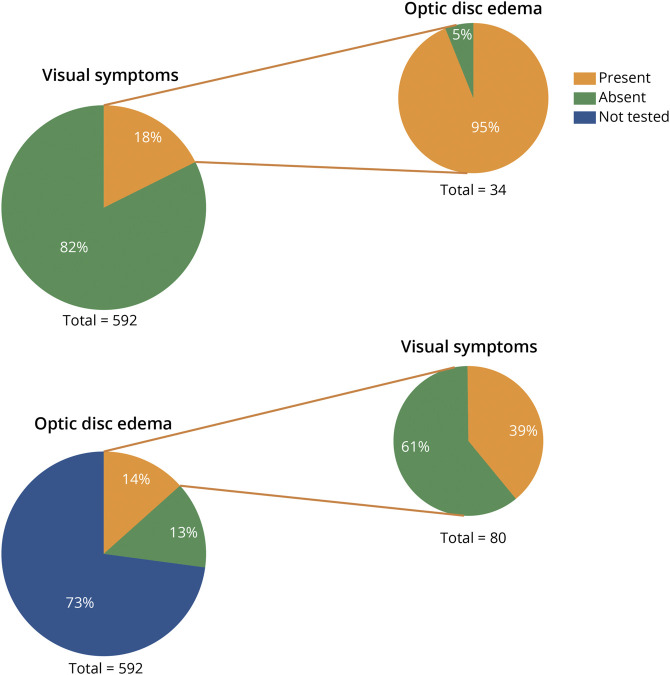
Figure 4. Proportion of Patients With vs Without Visual Symptoms, and Optic Disc Edema.
Pie graphs on the left describe all included patients. Graphs on the right indicate the proportion of symptomatic patients with optic disc edema (when assessed; top right) and the proportion of those with optic disc edema who did or did not report visual symptoms (bottom right).

