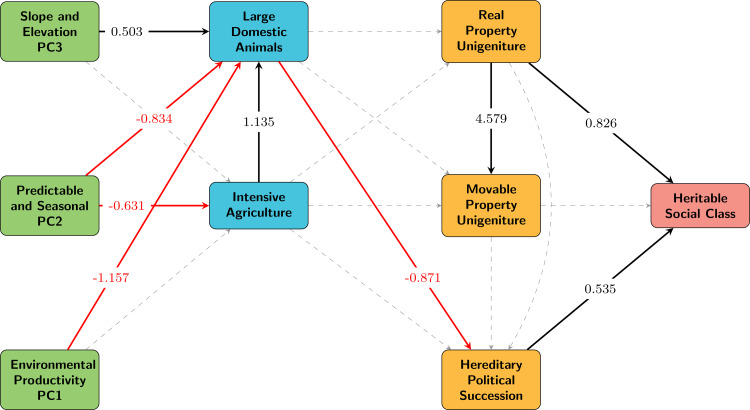
Figure 2.
Path diagram representation of a strictly stepwise trajectory to social inequality (interpreted through variables derived from D-PLACE). Red arrows indicate negative relationships identified in PiecewiseSEM model. Black arrows represent positive relationships identified in PiecewiseSEM model. Dashed arrows represent paths not found to be significant (P < 0.05). Significant paths are labelled with standardised coefficients. Individual variables represented by boxes in the diagram can be interpreted as increasing for continuous variables and present for categorical variables. PC1 is associated with environmental productivity, PC2 with predictable and seasonal environments and PC3 with slope and elevation (see Methods for details on PCA-derived environmental variables). Fisher's C = 65.598, P = 0, conditional R2 for class = 0.30 (see Tables S3–S5 for full results); n = 408.

