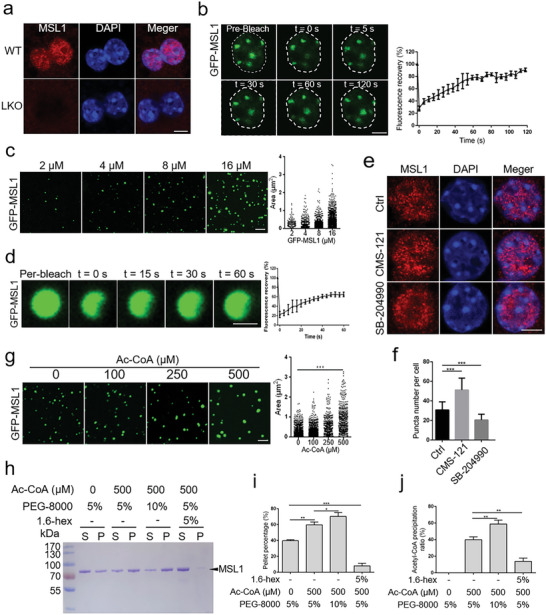
Figure 4.

MSL1 phase separation modulated by acetyl‐CoA in cells and in vitro. a) Primary mouse hepatocytes immunostained with an MSL1 antibody in WT and LKO mice. Scale bar, 5 µm. b) Fluorescence recovery after photo bleach (FRAP) time‐lapse images and quantification of GFP‐MSL1 condensates in live transfected HEK293T cells. Data are representative of three independent FRAP events. Scale bar, 5 µm. c) Confocal images and quantification of GFP‐MSL1 condensates at increasing protein concentrations (2 × 10⁻⁶–16 × 10−6 m). n = 3 fields (100 × 100 µm2). Scale bar, 5 µm. d) FRAP assays and quantification of GFP‐MSL1 (8 × 10⁻⁶ m) condensates. Data are representative of three independent FRAP events. Scale bar, 1 µm. e) Immunofluorescence images of MSL1 in primary hepatocytes treated with CMS‐121 (1 × 10⁻⁶ m) or SB‐204990 (10 × 10−6 m) for 24 h. Scale bar, 5 µm. f) Quantification of MSL1 nuclear puncta in primary hepatocytes (n = 20 cells). g) Confocal images of GFP‐MSL1 condensates (10 × 10−6 m) at increasing acetyl‐coenzyme A (Ac‐CoA) concentrations (0–500 × 10−6 m). n = 3 fields (100 × 100 µm2). Scale bar, 5 µm. h) SDS–PAGE assay of MSL1 recovered from the aqueous phase or supernatant (S) and the condensed phase or pellet (P). Ac‐CoA, PEG‐8000, or 1.6‐hex were added at the indicated concentrations. i) Quantification of the protein fraction recovered from pellets in the sedimentation assays. The sedimentation experiments were conducted in triplicates. j) Quantification of the Ac‐CoA recovered from pellets in the sedimentation assays, Ac‐CoA, PEG‐8000, and 1.6‐hex were added at the indicated concentrations. The sedimentation experiments were conducted in triplicates. The data were expressed as means ± SD. Significant difference was presented at the level of * p < 0.05, ** p <0.01, and *** p <0.001 by two‐tailed Student's t‐test.
