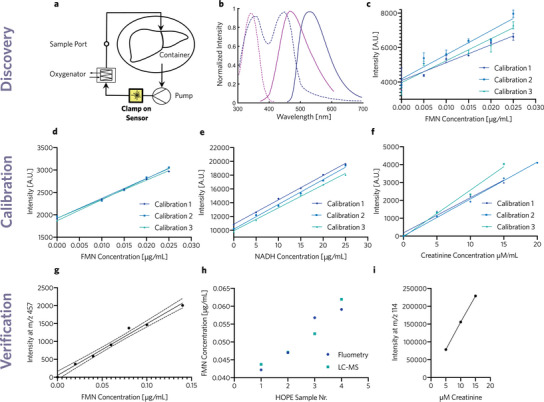
Figure 2.

a) Perfusion setup for hypothermic oxygenated liver perfusions, featuring a peristaltic pump, an oxygenator, a container, and our spectrofluorometric sensor. b) Absorbance (dashed) and emission (solid) spectra for NADH (purple) and FMN (blue) allow for spectrofluorometric measurements.[ 14 , 15 ] c) Plate reader measurements of FMN solutions based on the method of Muller et al.,[ 16 ] showing substantial sample‐to‐sample variability. d) Intensity, measured by the spectrometer, as a function of the perfusate FMN concentration, serving as a calibration for our device. FMN was excited at 405 nm and emission was measured at 530 nm. e) Spectrometer intensity as a function of perfusate NADH concentrations as calibration for our device. NADH was excited at 385 nm and emission was measured at 460 nm. f) Spectrometer intensity as a function of dialysate creatinine concentration as calibration of our device. g) Liquid chromatography mass spectrometry (LC‐MS) intensity peaks at m/z: 457 Da for different FMN concentrations to validate concentrations of calibration solutions. h) Fluorescent measurements were compared with LC‐MS intensity at 457 Da in collected HOPE perfusate samples, validating real‐time spectrofluorometric data with state‐of‐the‐art LC‐MS data in a biological fluid. i) LC‐MS intensity peaks at m/z 114 Da for different creatinine concentrations to confirm concentrations of calibration solutions.
