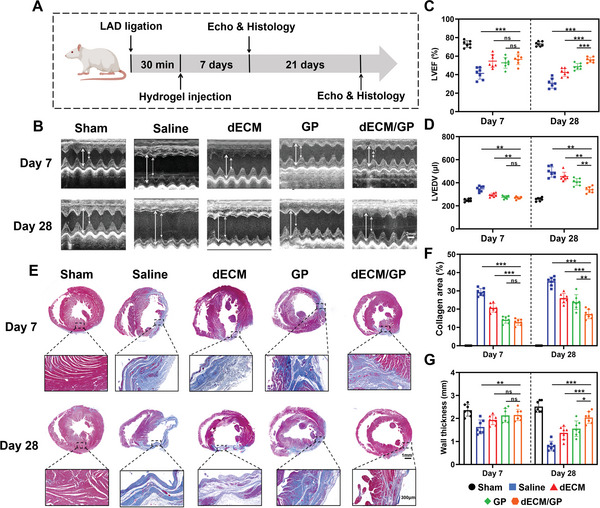
Figure 5.

dECM/GP modulated cardiac repair in a rat MI model. A) Schematic illustration of treatment in a rat MI model. B) Representative images of echocardiography reflecting cardiac function. The white full line indicates the LVIDd; the white dotted line indicates the LVIDs. Quantification of LVEF C) and LVEDV D) by echocardiography (n = 7). E) Representative Masson trichrome staining of harvested heart at the level of papillary muscles. Quantification of collage area F) and wall thickness G) by Masson trichrome staining (n = 7).
