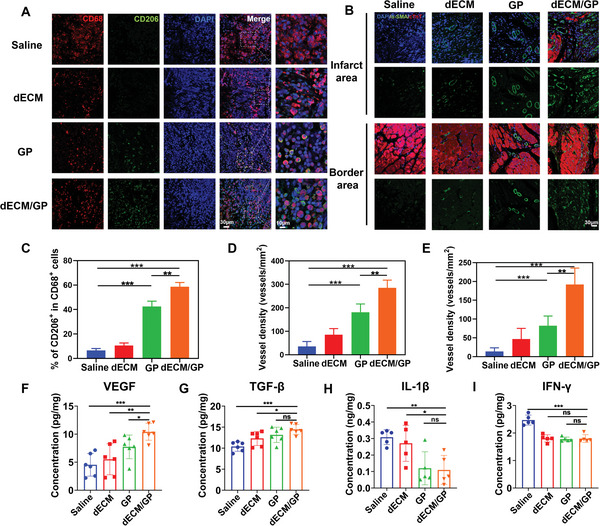
Figure 6.

dECM/GP promoted M2 macrophage polarization and angiogenesis post MI. A) Representative pictures of CD206/CD68 immunofluorescence staining on Day 7 post MI. B) Representative pictures of α‐SMA immunofluorescence in infarct and border area on Day 28 post MI. C) Statistical data of the percentage of M2 macrophages (n = 5). Quantitative analysis of α‐SMA positive vessels in infarct area D) and border E) (n = 7). Concentrations of VEGF F), TGF‐β G), IL‐1β H), and IFN‐γ I) in infarct area determined by ELISA (n = 6 or n = 5).
