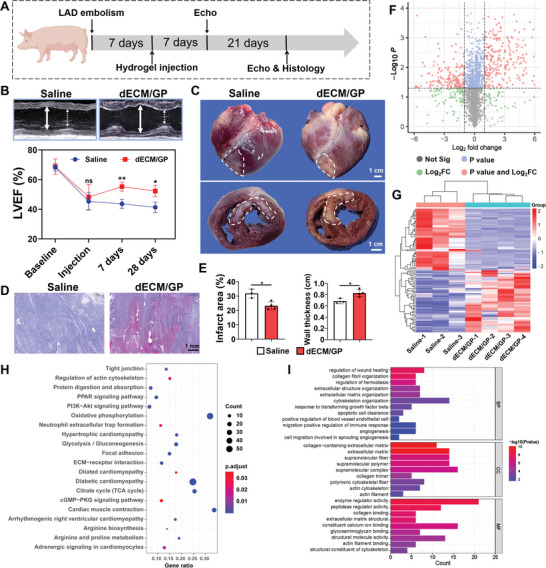
Figure 7.

dECM/GP modulated cardiac repair in porcine MI model. A) Schematic illustration of treatment in a porcine MI model. B) Representative images of echocardiography reflecting cardiac function and quantification of LVEF. The white full line indicates the LVIDd; the white dotted line indicates the LVIDs. C) Gross examination of and cross section of harvested hearts on 28 days. D) Representative Masson trichrome staining of harvested heart in infarct area. E) Quantification of collage area and wall thickness (n = 3 or n = 4). F) Volcano plots. The red dots indicate the proteins selected based on adjusted P value < 0.05 and log2 FC > 2. G) Cluster heatmap of the top 50 upregulated and down regulated DEPs. H) KEGG pathway‐enrichment analysis of DEPs. I) GO pathway‐enrichment analysis of DEPs. BP indicates biological process; CC indicates cellular component; and MF indicates molecular function.
