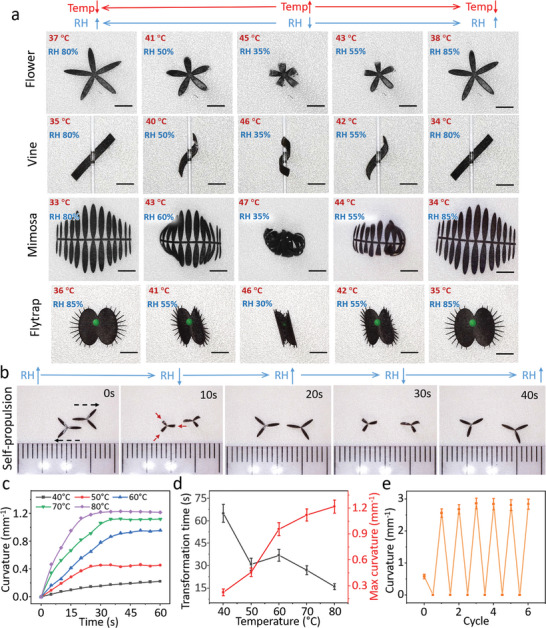
Figure 4.

Bioinspired shape morphing demonstrations as a function of the environmental humidity and temperature changes. a) Various reversible movements of artificial vegetation, including flowers, vines, mimosas, and flytraps. Scale bar: 2 mm. b) Self‐propulsion of the asymmetric petal‐shaped structures via circular RH shift. c) Time‐dependent curvature as a function of environmental temperature varying from 40 to 80 °C. d) Temperature‐dependent transformation time (black line) and maximum curvature (red line). Each dot represents the average transformation time and curvature for three different stripe structures under a temperature shift with stripe shapes ± SEM. e) Transformation cycle of the stripe structure in RH range of ≈30–95%. Each dot represents the average curvature for five different stripe structures under an RH shift with stripe shapes ± SEM.
