Figure 1.

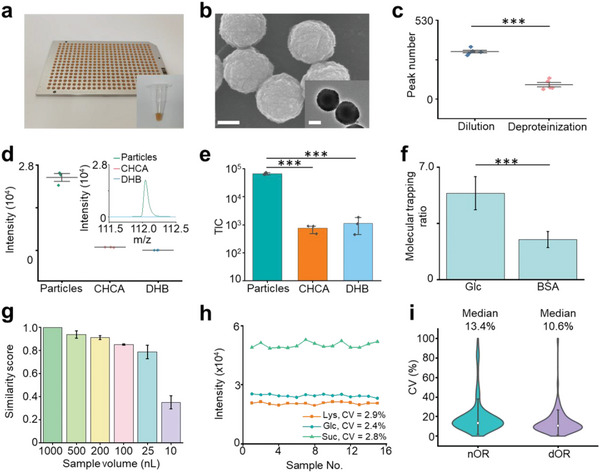
Characterization of the PALDI‐MS. a) Digital images of the microarray chip with 384 sample spots and particle solution dispersed by water in a 600 µL tube for the insert image. The distance between the centers of two spots on the chip was 4.5 mm. b) Scanning electron microscopy (SEM) image and transmission electron microscopy (TEM) image of particles (inset) showing the surface roughness of the particles. The scale bars for SEM and TEM images were 100 nm. c) The comparison for sample pretreatment of dilution and deproteinization, displaying more metabolites detected by dilution treatment. *** represented p < 0.001. d) The intensities of metabolites detected using particles, CHCA and DHB as the matrix, and typical mass spectra (insert) of 1.12 nmol Ala. The standard deviation (s.d.) of three tests was obtained as an error bar. e) The TIC of mass spectra for detecting standard mixture (including 10 ng mL−1 Glc, Suc, Ala, and Arg) using particles, CHCA, and DHB as the matrix. The error bars represented the s.d. of three replicates. *** represented p < 0.001. f) Molecular trapping ratios for Glc and BSA using particles as the matrix through elemental mapping results showing the selective trapping of particles for metabolites. The error bars represented ± s.d. *** represented p < 0.001. g) Cosine similarity scores of mass spectra from raw FF and its dilutions with dilution folds of 2–100 using 10–500 nL of raw FF samples. The error bars showed the s.d. of three samples. h) CVs of intensities for a standard mixture containing Lys, Glc, and Suc in 15 tests, showing the high reproducibility of PALDI‐MS using particle as the matrix. i) The CVs of intensities for FF samples from nOR and dOR subjects with five independent tests. The error bars represented ± s.d.
