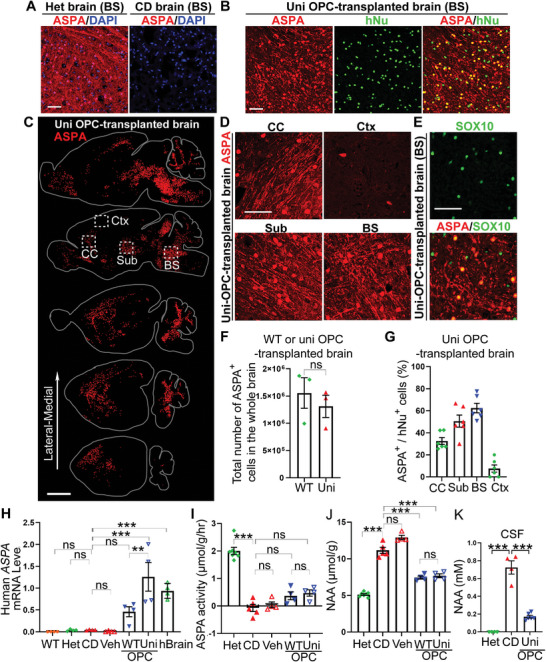
Figure 3.

Widely expressed ASPA and reduced NAA level in the WT and uni OPC‐transplanted CD (Nur7) mouse brains. A) Lack of the ASPA protein expression in CD (Nur7) mice due to the nonsense mutation in the ASPA gene. Immunostaining showed that the heterozygous (Het) mouse brains showed widespread ASPA expression, whereas no ASPA expression could be detected in the CD (nur7) mouse brains. Scale bar: 50 µm. B) Immunostaining for ASPA showed that the uni OPC‐transplanted CD (Nur7) mouse brains expressed ASPA. The ASPA expression in the cell body was colocalized with hNu. Scale bar: 50 µm. C) A serial sagittal dot maps showing widespread ASPA expression in the white matter track of the brain based on the immunostaining signal of ASPA in the cell body. Each series was begun from the lateral to the midline and continued at 900 µm intervals. Scale bar: 2000 µm. D) The ASPA staining images from the boxed regions in panel (D) are shown. In addition to cell body expression, ASPA was also expressed in the processes of oligodendrocytes. Shown are images from three regions, including the corpus callosum (CC), the subcortical white matter (Sub), the brain stem (BS), and the cortex (Ctx). Scale bar: 50 µm. E) Co‐expression of ASPA with the oligodendroglial lineage marker SOX10 in the uni OPC‐transplanted CD (Nur7) mouse brains. Scale bar: 50 µm. F) The total ASPA+ cells in the whole brain from WT and uni OPC‐transplanted mice. n = 3 mice for WT and uni OPC‐transplanted mice. G) The percentage of ASPA+ oligodendrocyte cells in the uni OPC (hNu+) ‐transplanted brains. About half of the human cells matured into oligodendrocytes and expressed the ASPA enzyme in the white matter regions, but low percentage in the cortex. n = 8 fields from 3 mice, with 2 images from each region in each mouse brain. H) Expression of the human ASPA mRNA in the WT and uni OPC‐transplanted mouse brains. The human cortex brain tissues were included as a positive control. Each dot represents the result from an individual mouse or human sample. n = 4 mice or human brain samples. I) Elevated ASPA activity and J) reduced NAA level in the WT and uni OPC‐transplanted CD (Nur7) mouse brains six months after transplantation. The NAA level was measured using NMR. The ASPA activity was measured by NMR and expressed as reduced NAA level per gram (g) of brain tissue within an hour (hr) (µmol/g/hr). Each dot represents the result from an individual mouse. n = 7 mice for the Het, 5 for the CD (Nur7) mice, 4 for the vehicle (Veh) control‐treated mice, 4 for the WT and uni OPC‐transplanted mice, respectively, for panels (I) and (J). K) Reduced NAA level in the cerebrospinal fluid (CSF) in the uni OPC‐transplanted CD (Nur7) mouse six months after transplantation. n = 4 mice for the Het and the CD (Nur7) mice, 6 for uni OPC‐transplanted mice, respectively, for panel (J). Error bars are SE of the mean. ns, not significant, **p < 0.01, ***p < 0.001 by Student's t‐test (two‐tailed) for panel (F), one‐way ANOVA followed by Dunnett's multiple comparisons test for panels (H) and (K), or by Tukey's multiple comparisons test for panels I and J.
