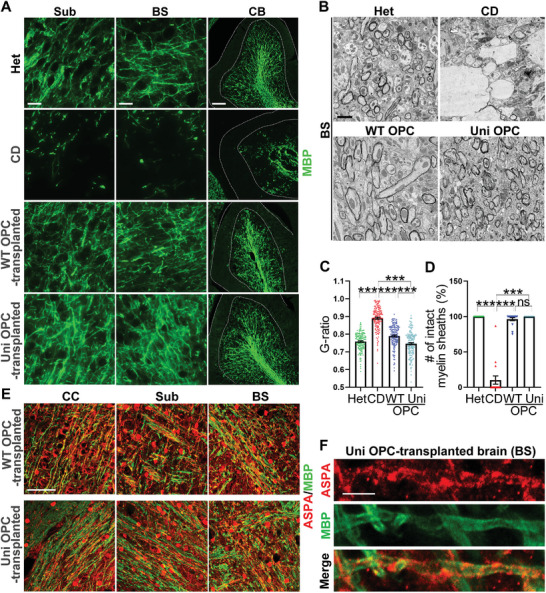
Figure 4.

Improved myelination in the WT and uni OPC‐transplanted CD (Nur7) mouse brains. A) Improved myelination in the WT and uni OPC‐transplanted CD (Nur7) mouse brains was shown by MBP staining. Shown are images from three regions, including the corpus callosum (CC), the subcortical white matter (Sub), and the cerebellum (CB). Scale bar: 25 µm for Sub and BS, 100 µm for CB in panel (B). B) Improved myelination as shown by electron microscopy and revealed by the increased number of intact myelin sheaths and the enhanced thickness of myelin sheaths in brains of the transplanted mice, compared to the control CD (Nur7) mice. Images of the subcortical white matter are shown. Scale bar: 2 µm. C,D) Quantification showing enhanced thickness of myelin sheaths as revealed by reduced G‐ratio (C) and increased number of intact myelin sheaths (D) in brains of the WT and uni OPC‐transplanted CD (Nur7) mice, compared to that in the control CD (Nur7) mice. n = 50 myelin sheaths from each region. Three regions, including the subcortical white matter, the brain stem and the cerebellum white matter from one mouse brain of each group were analyzed. E) Co‐localization of MBP and ASPA in different regions of the WT and uni OPC‐transplanted brains. Scale bar, 50 µm. F) Enlarged images showing the co‐localization of ASPA and MBP on the processes of oligodendrocytes. Scale bar: 5 µm. Error bars are SE of the mean. ns, not significant, ***p < 0.001 by one‐way ANOVA followed by Tukey's multiple comparisons test.
