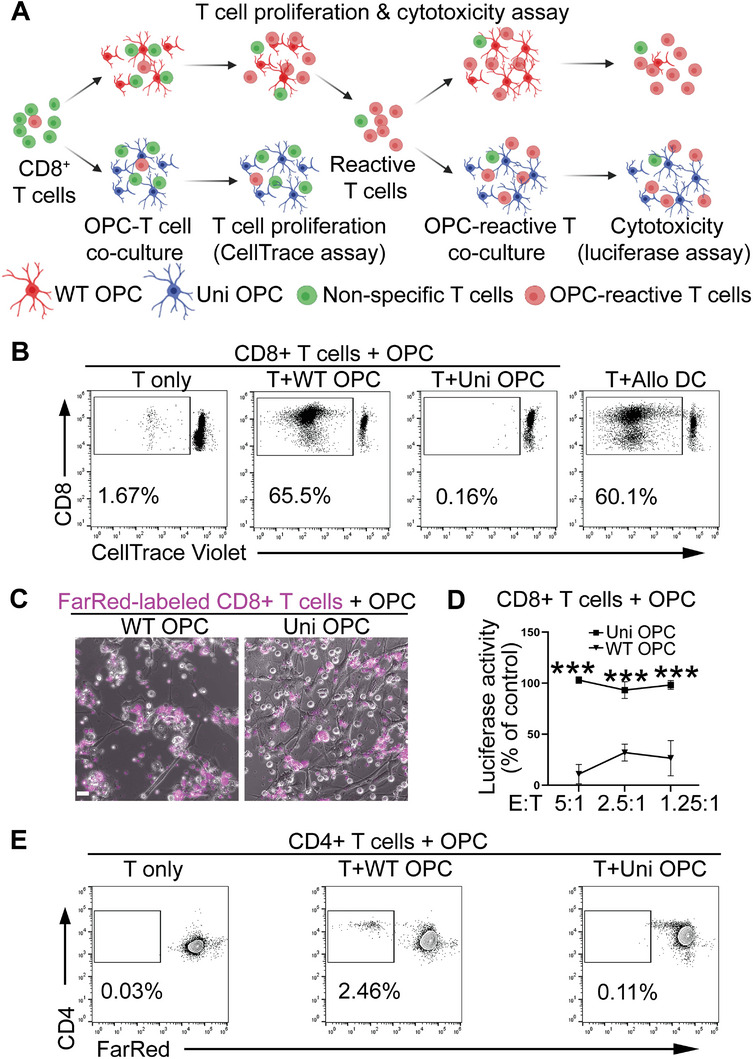
Figure 6.

The hypoimmunogenic universal (uni) OPCs exhibit low immunogenicity. A) A schematic for evaluating the immunogenicity of cytotoxic CD8+ T cells. The WT or uni OPCs were co‐cultured with CD8+ T cells isolated from allogenic PBMC and the proliferation of CD8+ T cells was tracked by the CellTrace dye. The reactive T cells were incubated with the WT or uni OPCs to assess CD8+ T cell cytotoxicity by a luciferase assay. B) The CD8+ T cells were expanded in response to the WT but not the uni OPCs. The CellTrace proliferation assay was used to detect the proliferation of CD8+ T cells in response to the WT or uni OPCs. The allogeneic dendritic cells (DC) were included as the positive control, while the CD8+ T cells only as the negative control. The CD8+ T cells were labeled with the CellTrace dye and the proliferated CD8+ T cells with low intensity of the CellTrace dye were gated. C,D) The WT but not uni OPCs were lysed by CD8+ T cells. The WT or uni OPCs carrying a luciferase reporter were co‐cultured with reactive CD8+ T cells labeled by the CellTrace‐FarRed dye for 48 h. Images are shown in panel (C). Luciferase activity are shown in panel (D). Scale bar: 100 µm. E) The universal OPCs exhibited low immunogenicity for CD4+ T cells. The CellTrace proliferation assay was performed to detect proliferative CD4+ T cells in response to on the WT or uni OPCs. CD4+ T cells were labeled with CellTrace‐FarRed and proliferated CD4+ T cells with low intensity of CellTrace dye were gated. CD8+ T cells and CD4+ T cells isolated from Donor 3 were used for Figure 2 ***p < 0.001 by two‐way ANOVA followed by Benferroni's multiple comparisons test for panel (D).
