
Fig. 4. Survival curves for progression to PD or DLB stratified by LB status at baseline.
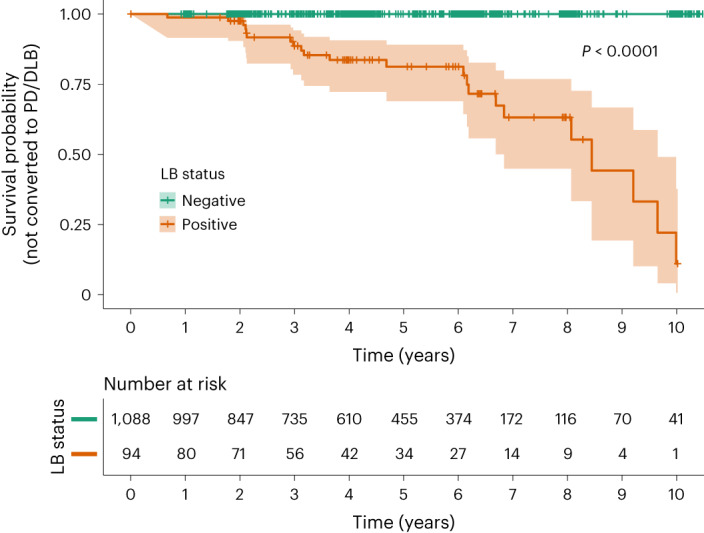
The event was met when a participant fulfilled the clinical criteria for PD49 or DLB50 (alternatively, prodromal DLB42). Lines show point estimates of survival curves and shaded areas 95% CI. Vertical lines indicate time points of censoring. The table below shows the number of participants at each time point that had not yet progressed to PD/DLB. No participants who were LB– at baseline progressed to PD/DLB. See Extended Data Table 4 for specifications of progression to a clinical diagnosis based on AD/LB positivity. P value derived from the log-rank test and indicates that the survival curves (that is, time to PD/DLB) of LB+ and LB– participants are significantly different.