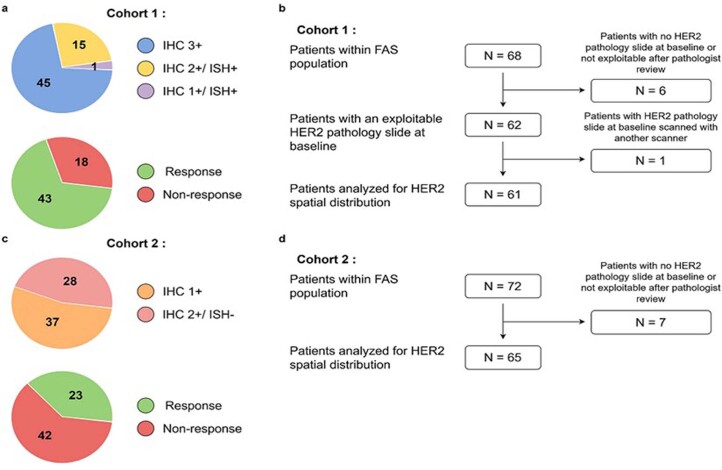
Extended Data Fig. 5. Dataset description for HER2 expression spatial analysis.
a. Distribution of HER2 IHC score and confirmed objective response in the dataset in cohort 1 (HER2-overexpressing). The numbers represent the number of patients analyzed (n = 61). b. Description of the patient set considered for HER2 spatial distribution analysis in cohort 1. c. Distribution of HER2 IHC score and confirmed objective response in the dataset in cohort 2 (HER2-low). The numbers represent the number of patients analyzed (n = 65). d. Description of the patient set considered for HER2 spatial distribution analysis in cohort 2.

