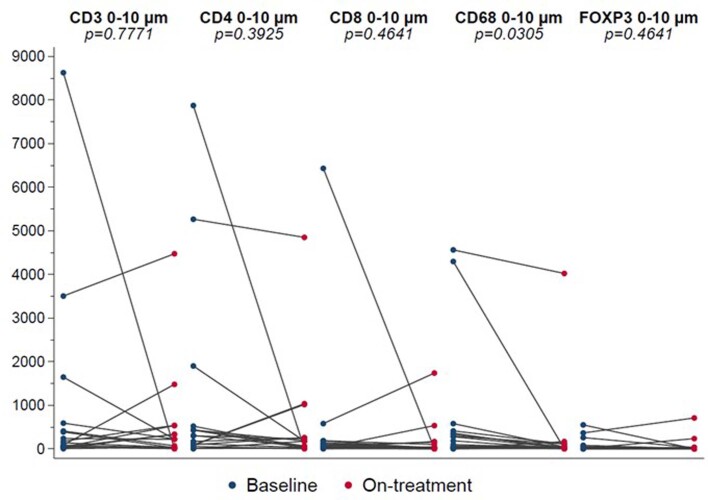
Extended Data Fig. 8. Immune cell density at 0 to 10 µm of tumor cells, in baseline and on treatment tumor biopsies in cohort 1 (HER2-overexpressing, n = 18).
A significant decrease in tumor cell-proximate macrophage was observed during treatment (FDR-adjusted p = 0.0305). Blue bullets and red ones represents at baseline and on-treatment samples, respectively. P-values were calculated using the Wilcoxon matched-pairs signed-rank test and adjusted for multiple hypothesis testing using the Benjamini-Hochberg method. All statistical tests were two sided.

