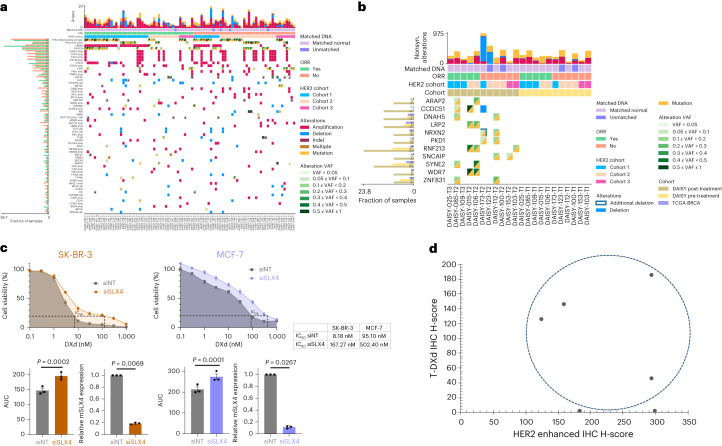
Fig. 5. Mechanisms of resistance to T-DXd.
a, Oncoplot of driver mutations and CNAs identified in at least 3% of tumor biopsies at baseline (n = 89). Blood samples were available for analyses in 84 patients. If a gene has at least one driver mutation or CNA in at least 3% of pretreatment biopsies, any other driver alteration of the same gene is shown, regardless of its frequency. b, Oncoplot of acquired genomic alterations identified at resistance (n = 11). Eleven biopsies at resistance (on the left) were matched with pretreatment biopsies (on the right) from the same patient. Only genes that were not altered in any of the 11 pretreatment samples and that acquired an alteration in at least two samples at resistance (three samples in case all events were CNAs) are shown. The left histogram depicts the frequency at which the gene was altered in the pretreatment (n = 89), resistance (n = 21) and TCGA-BRCA (n = 684) cohorts for comparison. c, Dose–response survival curves of SK-BR-3 and MCF-7 cell lines transfected with non-targeting or SLX4-targeted siRNAs (siNT or siSLX4, respectively) and exposed to DXd at the indicated doses for 5 days. Area under the curve (AUC) and IC80 values were determined for each condition. Data are mean surviving fractions ± s.e.m., n = 3 experiments for both cell lines. Statistical analysis was performed using Welch’s t-test (two-tailed). d, Illustration of T-DXd uptake and HER2 expression at resistance (n = 6). T-DXd was determined by IHC using an Ac anti-DXd (H-score) and HER2 by an enhanced protocol of IHC (H-score). T-DXd was observed in four of six patients whose biopsy at resistance was done ≤6 weeks after last T-DXd infusion.

