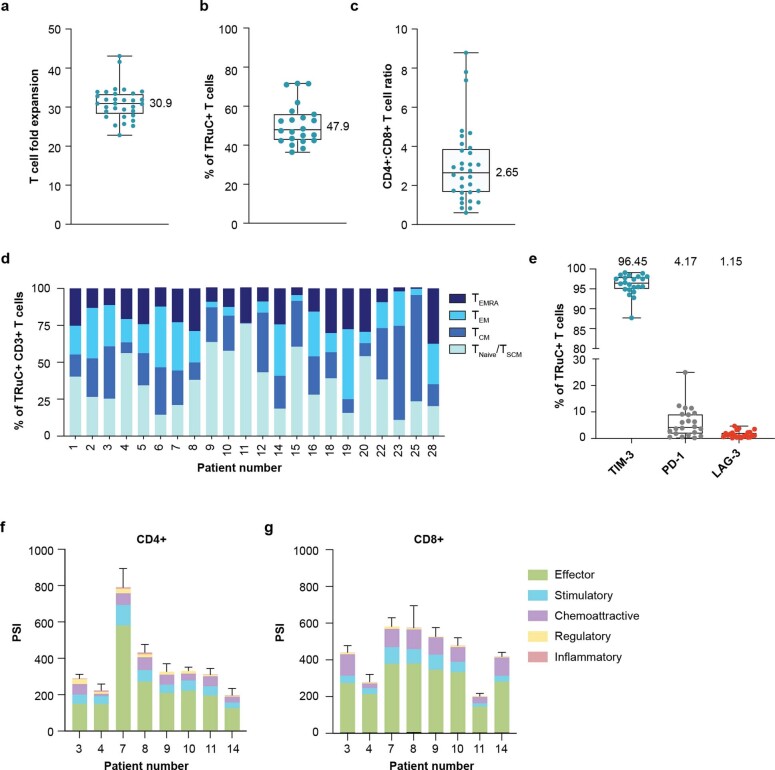
Extended Data Fig. 7. Characterization of gavo-cel T cell products (TCPs).
Flow cytometry methods were used to characterize TCPs. a, Median fold expansion of the TCPs during the manufacturing process was 30.9 (n = 32 independent patient samples). b, Percent of TRuC+ T cells was 47.9% (n = 22 independent patient samples). c, The ratio of CD4+ to CD8 + T cells was 2.65 (n = 32 independent patient samples). For box-plots, center line, box limits and whiskers represent the median, interquartile range and minima and maxima, respectively. d, Memory subset composition using the markers CD45RA and CCR7 showed variable composition of stem cell memory (TSCM) and naïve T cells, central memory T cell (TCM), T effector memory cell (TEM) and effector memory T cells re-expressing CD45RA (TEMRA subsets). e, Expression of the exhaustion markers TIM-3, PD-1, and LAG-3 were determined by flow-cytometry. TIM-3 expression was high, PD-1 was variable, and LAG-3 was low. (n = 22 independent patient samples) For box plots; center lines, box limits and whiskers represent the median, interquartile range and minima and maxima, respectively. f–g, Gavo-cel T cell products TCPs show robust polyfunctionality. Multiplexed assessment of cytokine production at the single cell level was performed by Isoplexis assay in isolated f, CD4+ (n = 8 independent patient samples) and g, CD8 + T cells within gavo-cel TCPs. (n = 8 independent patient samples) Polyfunctionality of T cells defined as a cell co-secreting 2 or more cytokines were analyzed by the IsoSpeak software across the seven functional groups. The polyfunctional strength Index (PSI) of T cells was defined as the percentage of polyfunctional cells, multiplied by the sum of the mean fluorescence intensity (MFI) of the proteins secreted by those cells: PSI = (% polyfunctional cells in sample) x ∑(MFI of all 32 secreted proteins of the polyfunctional cells).TCP predominantly secreted effector, stimulatory, and chemo attractive proteins Source.

