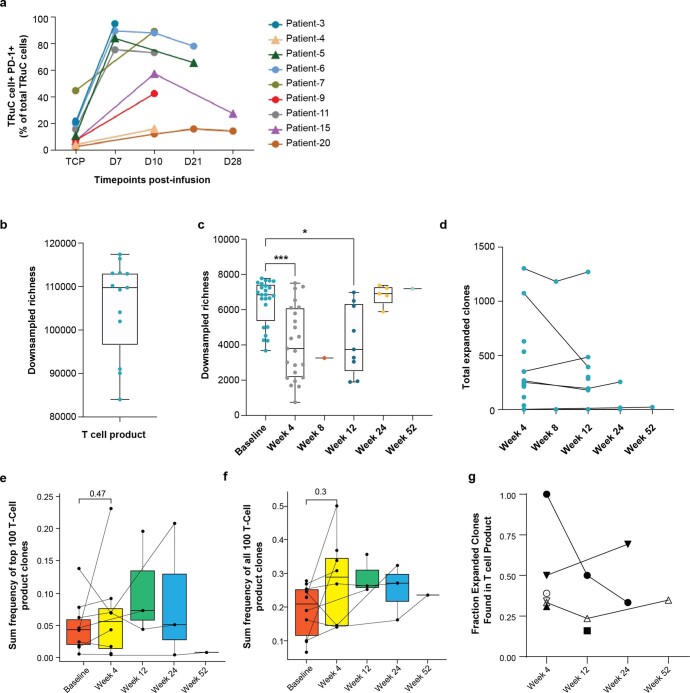
Extended Data Fig. 9. PD1 expression and T cell clonotypic expansion in blood post-gavo-cel infusion.
a, PD1 expression. Percent of PD1 positive gavo-cel T cells in the manufactured T cell product (TCP) and at different time-points post infusion. Circles denote subjects with stable disease whereas triangles denote subjects that achieved a partial response. These data show that irrespective of response, PD-1 expression on gavo-cel T cells increases post-infusion. b–g, Clonotypic analysis was performed by TCRB CDR3 sequencing. b, Downsampled richness as a measure of clonal diversity in analyzed TCPs. (n = 13 independent patient samples) c, Analysis of downsampled richness in the blood at baseline and longitudinally for all available subjects post-infusion. (n = 30 subjects, with varying longitudinally sample availability, baseline vs. week 4 ***p = 0.001, baseline vs. week 12 * p = 0.0473) d, Longitudinal analysis of total expanded clones for all available patients. e–f, Top 100 T cell product (TCP) clones and the sum frequency of clones found in peripheral blood over time (up to 52 weeks) are shown for all analyzed subjects. (n = 8 subjects, with varying longitudinally sample availability) g, Proportion of expanded clones found in the TCP. (n = 12 independent patients, with varying longitudinally sample availability). For c, e, f Statistical significance was determined by Kruskal-Wallis ANOVA and a Dunn’s multiple comparison to determine the p-value. For box-plots; center line, box limits and whiskers represent the median, interquartile range and minima and maxima, respectively.

