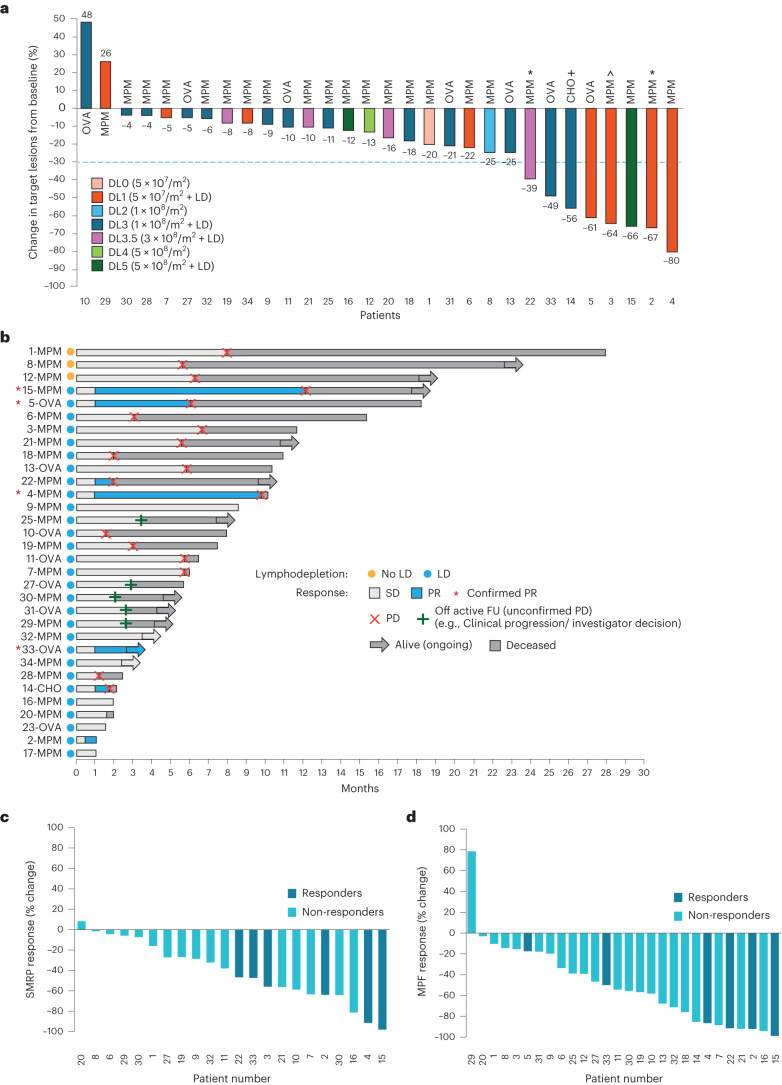
Fig. 2. Efficacy of gavo-cel treatment.
a, Waterfall plot showing maximum change in target lesion size from baseline in evaluable patients (n = 30) as assessed by BICR. Bars are colored according to DLs. * Patients 2 and 22 had an unconfirmed PR; + patient 14 had an unconfirmed PR by local investigator assessment; ^ patient 3 showed more than 30% regression of target lesions on a 6-month CT scan but also a new lesion that prevented the patient from achieving a PR. CHO, cholangiocarcinoma; OVA, ovarian cancer. b, Swimmer plot showing best responses of each patient over time, assessed according to RECIST version 1.1. * confirmed PR. c,d, Changes in circulating surrogate markers of tumor response. Waterfall plots showing best response (% change from baseline) and SMRPs as measured in plasma using the MESOMARK assay (c) and MPF as measured in plasma using an ELISA assay (d). Responders (partial or complete response) and non-responders (SD and PD) are indicated by color-coded bars. FU, follow-up.

