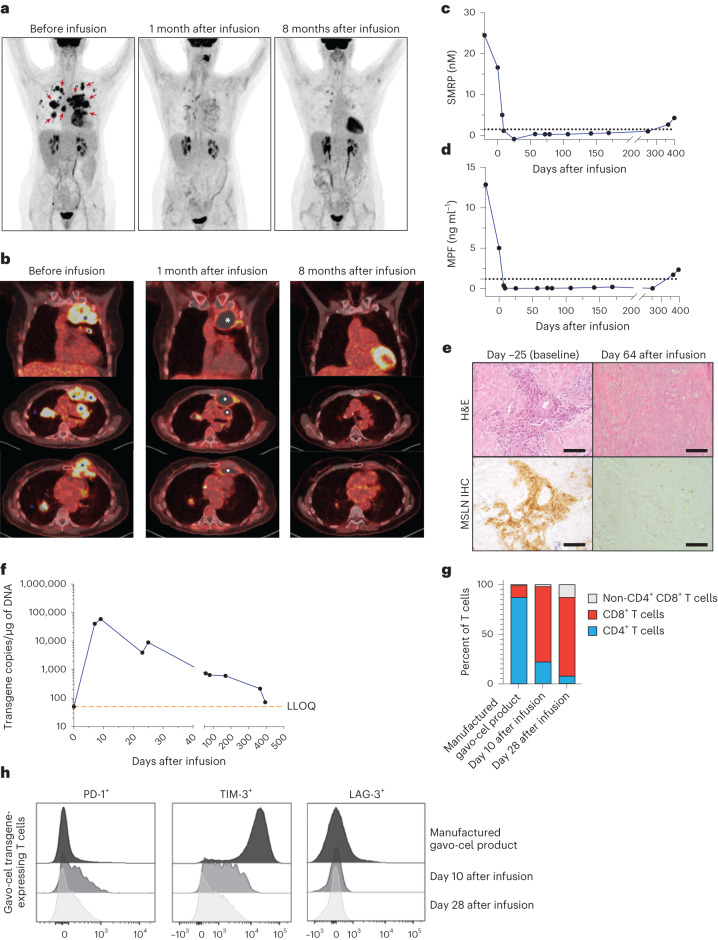
Fig. 3. Tumor regression in a patient (patient 15) with MPM after gavo-cel treatment.
a, Frontal view of 18F-FDG PET maximum intensity projection obtained before infusion, approximately 1 month after infusion and 8 months after infusion. Areas of tumor involvement are indicated by red arrows. b, Representative PET–CT images obtained at the same timepoints as in a. Top part of b is coronal image at level of ascending aorta; middle part is axial section at level just below carina; and lower part is axial section at level of base of heart. Tumor areas are indicated by blue asterisk, and fluid-filled regions after tumor regression are marked with white asterisk. c,d, Circulating surrogate tumor response biomarker. c, Decrease in SMRP after gavo-cel infusion. d, Decrease in MPF level after infusion. e, Mesothelin-specific cell killing in post-infusion tumor biopsy. Tumor biopsies obtained at enrollment and 64 d after gavo-cel infusion were stained with hematoxylin and eosin (H&E) (top). Mesothelin expression was evaluated by IHC (bottom). H&E staining indicated the presence of epithelioid malignant mesothelioma, with most tumor cells showing 3+ mesothelin staining intensity at baseline. The tumor biopsy obtained 8 weeks after gavo-cel infusion showed complete tumor necrosis with loss of mesothelin expression in dead cells. Experiment was performed once on patient samples collected at different timepoints. Inset scale bars, 100 µM. f, Persistence of gavo-cel in peripheral blood after infusion by qPCR. Peak expansion was observed at day −10, followed by a contraction phase that plateaued approximately 60 d after infusion, with gavo-cel T cells remaining detectable at the latest measurement: 1 year after infusion. g, Phenotypic analysis of gavo-cel product and post-infusion kinetics. Proportion of CD4+ and CD8+ T cell subsets in manufactured gavo-cel product and in the gavo-cel transgene-expressing T cells obtained from peripheral blood of the patient after infusion. h, Exhaustion markers in gavo-cel manufactured product and in the gavo-cel transgene-expressing T cells obtained from the patient’s peripheral blood after the infusion. Expression of PD-1, TIM-3 and LAG-1 in manufactured gavo-cel product, on gavo-cel transgene-expressing T cells on days 10 and 28 after infusion. MSLN, mesothelin.

