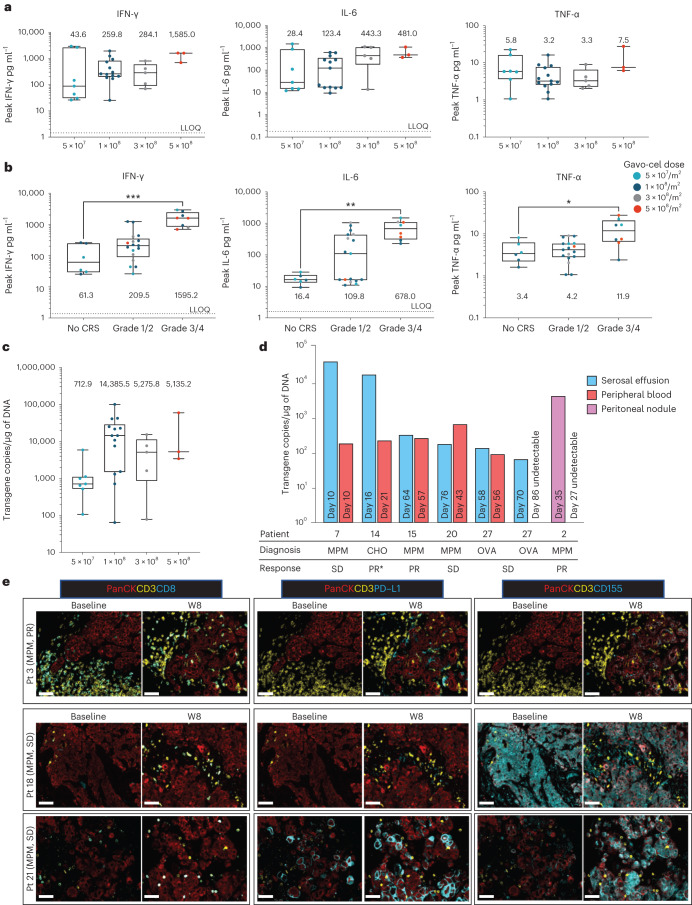
Fig. 4. Cytokine response, gavo-cel expansion and persistence.
a,b, Peak cytokine response by DL and correlation of peak cytokine levels with CRS. Plasma cytokine levels were measured longitudinally in the peripheral blood using a validated multiplexed immunoassay (MSD). Horizontal lines and boxes show the medians and interquartile ranges. a, Peak levels of IFN-γ, IL-6 and TNF-α after gavo-cel infusion in patients who received LD (for the 5 × 10⁷/m2 cohort, n = 7 independent patient samples; for the 1 × 10⁸/m2 cohort, n = 13 independent patient samples; for the 3 × 10⁸/m2 cohort, n = 5 independent patient samples; for the 5 × 10⁸/m2 cohort, n = 3 independent patient samples). b, Correlative analysis of peak IFN-γ, IL-6 and TNF-α levels with grade of CRS (for the no-CRS cohort, n = 6 independent patient samples; for the grade 1/2 cohort, n = 17 independent patient samples; for the grade 3/4 cohort, n = 8 independent patient samples; statistical significance was determined by one-way Kruskal−Wallis ANOVA: IFN-γ ***P = 0.0003; IL-6 **P = 0.02; TNF-α *P = 0.002). c,d, Expansion and persistence of gavo-cel. Gavo-cel expansion was monitored by qRT–PCR c, Peak expansion (Cmax) levels of gavo-cel T cells in peripheral blood by DL shows maximum expansion in DL 1 × 10⁸/m2 (for the 5 × 10⁷/m2 cohort, n = 7; for the 1 × 10⁸/m2 cohort, n = 14; for the 3 × 10⁸/m2 cohort, n = 5; for the 5 × 10⁸/m2 cohort, n = 3). For box plots: center line, box limits and whiskers represent the median, interquartile range and minima and maxima, respectively. d, Expansion of gavo-cel T cells in malignant serosal effusions, peripheral blood and peritoneal nodule. Experiment was performed once on each independent patient sample. CHO, cholangiocarcinoma; OVA, ovarian cancer; PR*, partial response by investigator assessment. e, Characterization of TME before and after gavo-cel infusion by multiplex immunofluorescence. Multiplex immunofluorescent staining was performed for cytokeratin (PanCK, tumor marker), CD3 (pan-T cell marker), CD8, PD-L1 and CD155 in MPM tumor biopsies taken at baseline and at week 8 after gavo-cel infusion from patient 3, who achieved a PR by best target lesion response, and patients 18 and 21, both having a best response of SD. Experiment was performed once on each independent patient sample. Scale bars, 50 µM. Pt, patient; W, week.

