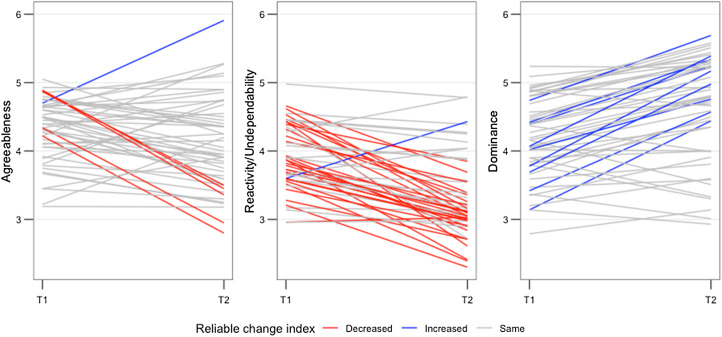
Figure 2.
Individual reliable change index (RCI) values for agreeableness, dominance and reactivity/undependability, which all showed significant mean level change over time. Red lines show individuals whose RCI value significantly decreased, blue lines indicate individuals whose RCI value significantly increased and grey lines indicate individual's whose RCI value did not change significantly over the time points

