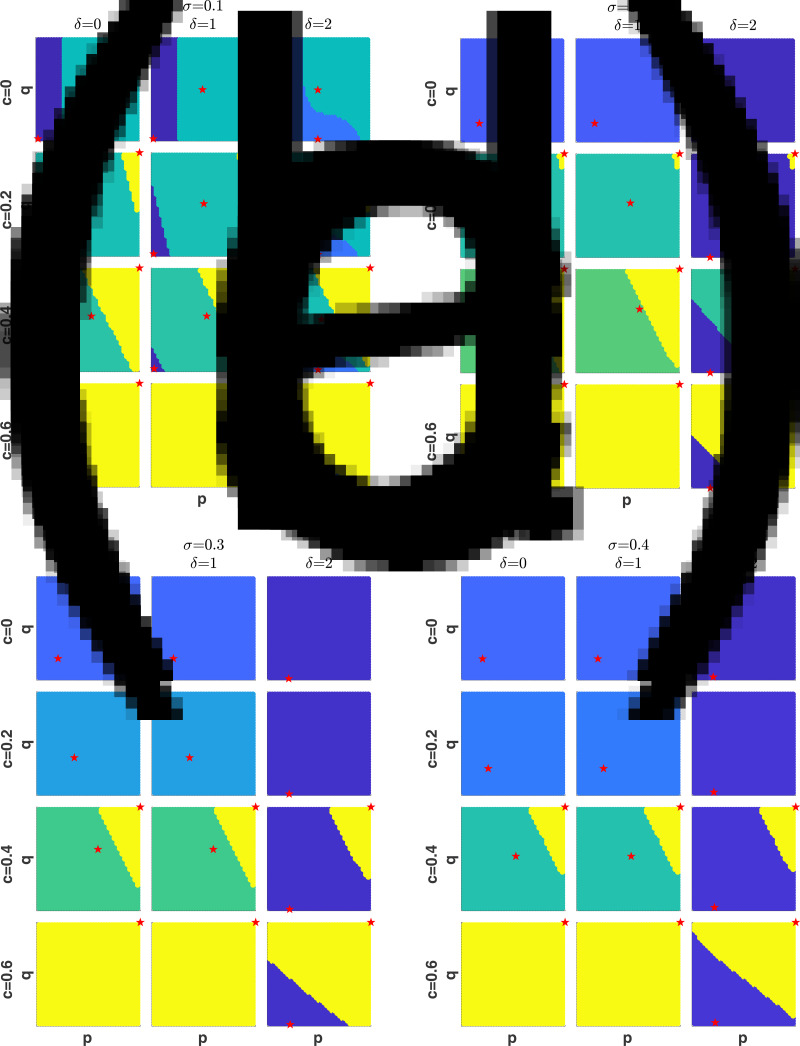
Figure 4.
Stable equilibria (marked by red stars) and their domains of attractions (painted by the same color) on the (p, q)-phase plane in the model with both passive and active disapproval for different values of parameters c, δ and σ. The underlying distribution of v is a sum of two lognormal distributions with mean values at v̅ and 1 − v̅ andthe same σ. v̅ = 0.2, κ = 0.8.

