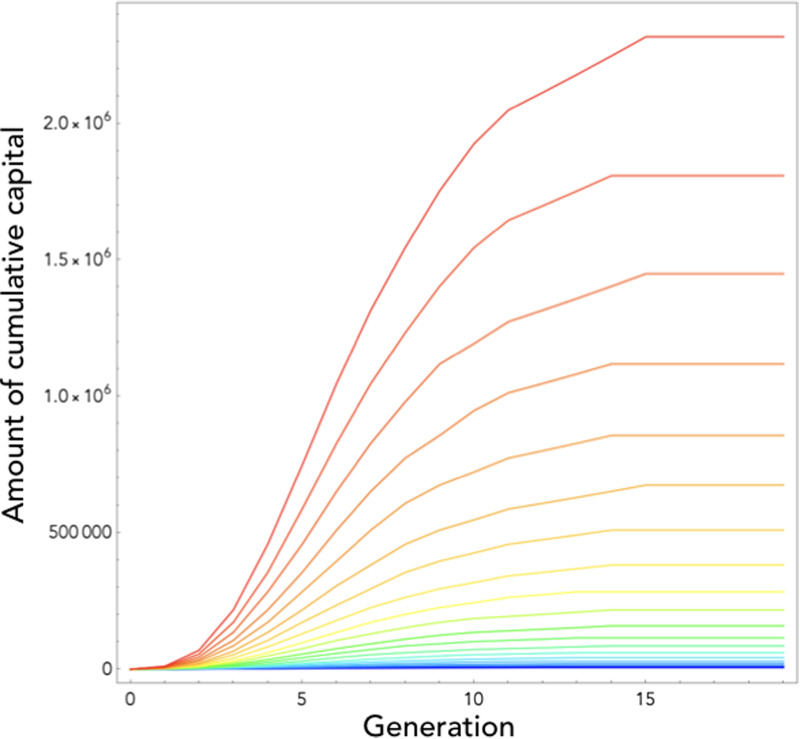
Figure 3.
Cultural dynamics in model 2. Here we plot the dynamics of heritable capital through generations for 20 different values of population size ranging from N = 1 (blue curve) to N = 2200 (red curve). Parameters are as in Figure 2, with the time-step used in numerical simulations δ = 0.01

