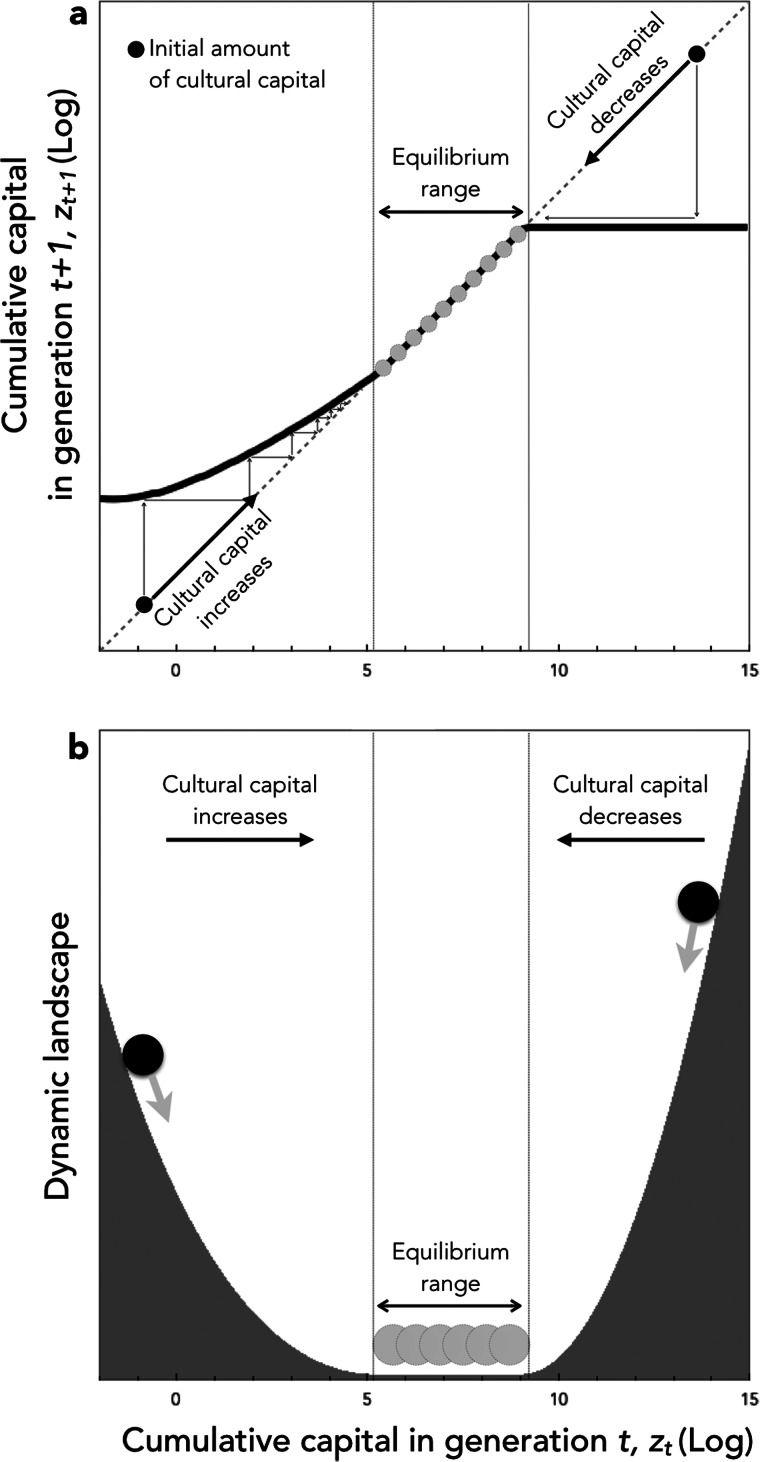
Figure 4.
Cultural evolution in model 2. (a) The thick solid line shows the amount of cultural capital in generation t + 1 plotted in function of cultural capital in generation t. The dashed line shows the identity function. This allows graphical representation of the dynamics of culture from any initial condition, by directly reading, at each generation, the amount of culture reached in the next generation (see the thin arrows). When culture is initially low, it increases. When culture is initially high, it decreases. In between, culture has a range of intermediate equilibria. (b) Graphic representation of cultural dynamics through an analogy with a physical landscape. This allows an intuitive perception of the dynamics by picturing the course of a ball going down the hills and stopping in the plain. The landscape is constructed by setting its slope for each value of zt as being proportional to the change of cultural capital in one generation when starting from zt. Parameters are as in Figure 3, with population size N = 1000.

