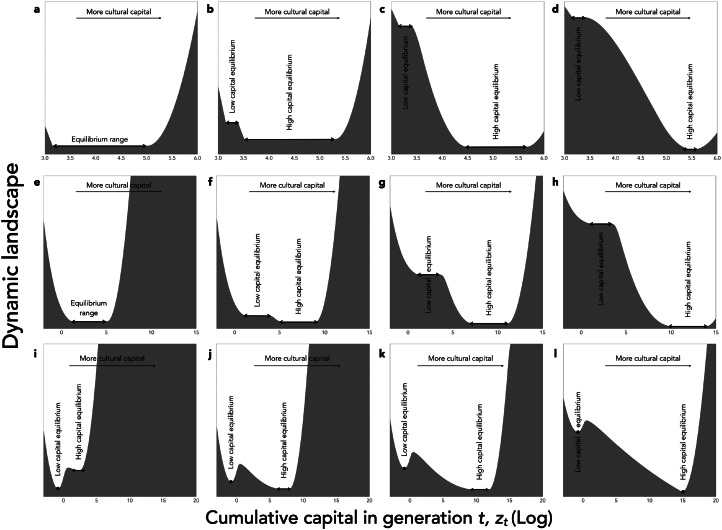
Figure 5.
Cultural dynamics when culture is a capital. Graphic representation of cultural dynamics through an analogy with a physical landscape, as in Figure 4. (a–d) Investments in knowledge increase along the pyramid of needs, with parameters as in Figure 3, but with α = (1 − c)ζ and β = cζ, where ζ = 0.9, and c is a hard threshold function of x: c = clow for  , and c = chigh for
  , with
  , clow = 0.05, and chigh = 0.05 (a), chigh = 0.1 (b), chigh = 0.5 (c) or chigh = 1 (d). (e–h) Age at maturity increases with cultural capital, with parameters as in Figure 3, but with the time available for growth, L, varying as a function of z according to a sigmoid function:
 , with
  , Llow = 10, and Lhigh = 10 (e), Lhigh = 30 (f), Lhigh = 50 (g), or Lhigh = 100 (h). (i–l) With division of labour, and parameters as in Figure 3, but with α = β = 0.5, and the division of labour model described in the section B of Supporting Information with λmin = 0.01, ϕ = z, u = 1, and the exponent of the production cost varying in function of z according to eq. 18 in Supporting Information, with ahigh = 2, alow = 1, and σ = 10, and with population size N = 10 (i), N = 50 (j), N = 100 (k) or N = 1000 (l).

