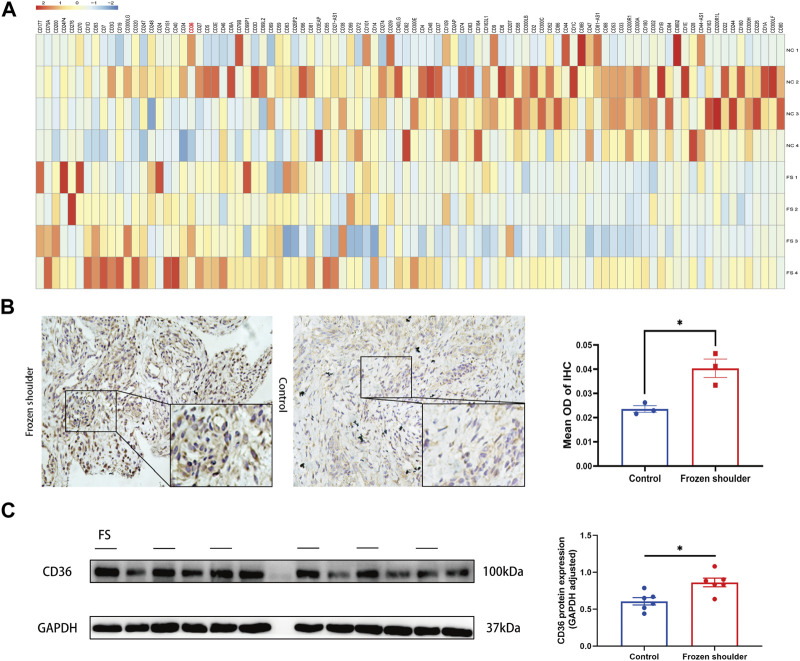
FIGURE 2.
Different expression of CD36 at both tissue and cellular level between FS and control group. (A) RNA-seq analysis suggested that CD36 was one of the most up-regulated molecules on surface of synovial fibroblasts. (B) Western blotting results showed that synovial fibroblasts in FS expressed more CD36 than that in the control group. Scale bar: 50 µm. (C) IHC results suggested that more CD36 was expressed in the synovium tissue derived from FS than that from the control group. *p < 0.05; **p < 0.01; ***p < 0.001.

