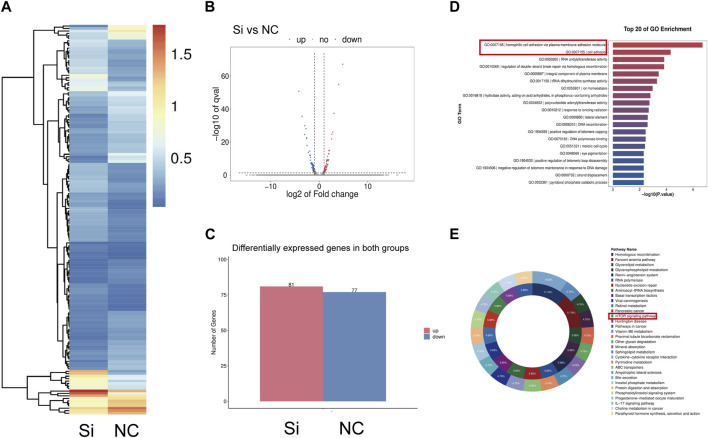
FIGURE 5.
Gene expression change of synovium fibroblasts after CD36 knockdown. (A–C) A total of 158 mRNA were differently expressed (Fold Change ≥2 and Adjusted p-value ≤0.001) between siRNA group and the control group, among which 81 were upregulated and 77 were down-regulated. (D) KEGG pathway analysis was performed to determine the pivotal signaling pathways within the differentially expressed genes. (E) GO analysis was performed to investigate the vital change of cell function after knocking down the CD36 gene in synovial fibroblast.

