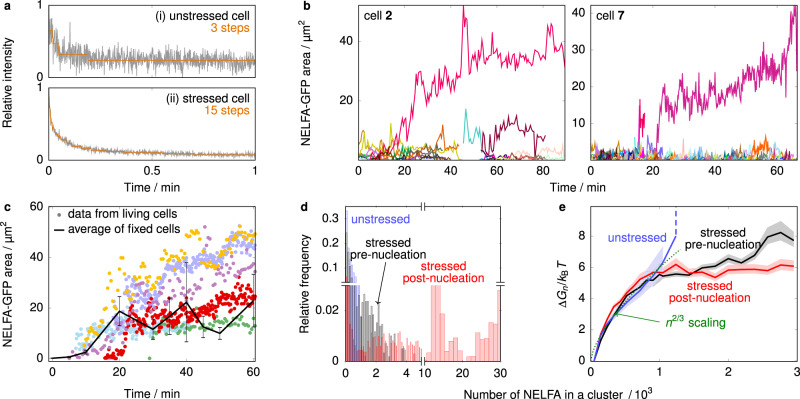
Fig. 2. Quantification of dynamic transient clusters.
a For conversion of areas of GFP regions into numbers of NELFA-GFP molecules, photobleaching steps were measured. Two example curves are shown for an unstressed cell (top) and a stressed cell (bottom), respectively. Steps (3 and 15, respectively) were determined by AutoStepfinder. b Time-resolved data for all clusters and condensates sizes of NELFA-GFP regions in two example living HeLa cells (see Supplementary Note 7 for the data of all cells). Individual clusters are shown in different colours. Most grow and shrink, and can reach sizes up to ~14 μm2. Only once this size is exceeded do clusters grow steadily into a condensate (see main text for a quantification). c The black line gives sizes of clusters and condensates averaged over all 35 fixed HeLa cells, while circles are tracked sizes of NELFA-GFP regions in living HeLa cells. Each colour represents a distinct cluster that ultimately grows into a NELFA-GFP condensate in living-cell experiments. d The probability of a monomer being in a cluster of a certain size for stressed cells prior to nucleation, after nucleation started (post-nucleation) and for unstressed cells. e The free energy as a function of cluster size, computed from the probabilities in panel d (see main text for details). The centre line gives the mean over all the data values, and 99% confidence intervals shown are computed from 10,000 bootstrap samplings of data values. In d and e, data from seven stressed cells (1262 cluster sizes pre- and 3028 post-nucleation) and three unstressed cells (679 clusters) are shown. Numbers of NELFA are corrected for unlabelled protein.

