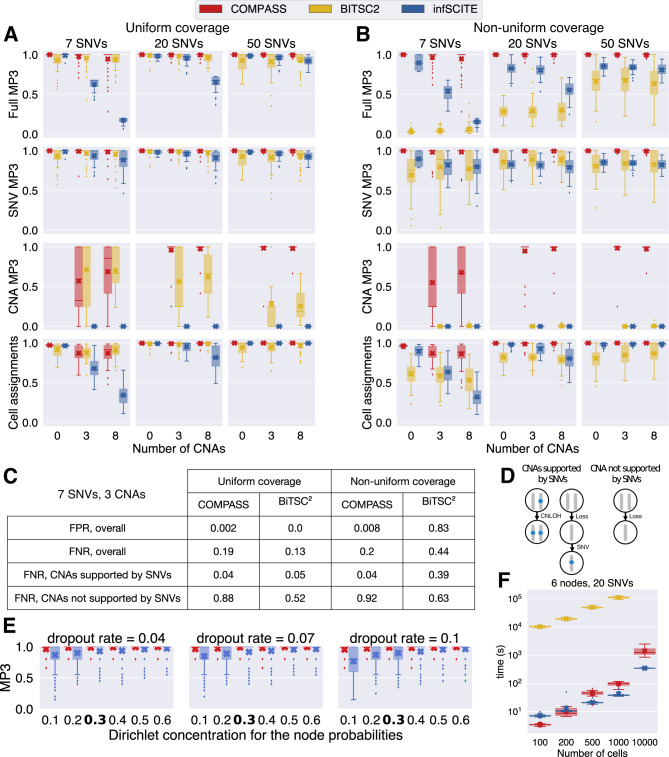
Fig. 2. Evaluation of COMPASS, BiTSC2 and SCITE on synthetic data.
The boxplots represent the median and first and third quartiles, crosses indicate means, whiskers show the rest of the distribution up to 1.5 times the interquartile length, and outliers not within this range are shown as diamonds. A, B MP3 similarity (full, only SNVs or only CNAs) between the inferred and true trees, and accuracy of cell assignments, for different number of SNVs and CNAs, with uniform (A) or non-uniform (B) coverage. For each setting, we generated 50 different trees. C False positive rate (FPR) and false negative rate (FNR) for the CNA calls of COMPASS and BiTSC2, when 7 SNVs and 3 CNAs were used. D Sketch explaining our definition of CNAs supported by SNVs: these CNAs contain in the same node, or in one of their descendant, a SNV or a LOH. E Evaluation of SCITE with different dropout rates and concentration parameters for the node probabilities (the higher the concentration parameter is, the more similar the node sizes are). The highlighted value (0.3) corresponds to the one estimated from real data. F Runtimes.

